
|
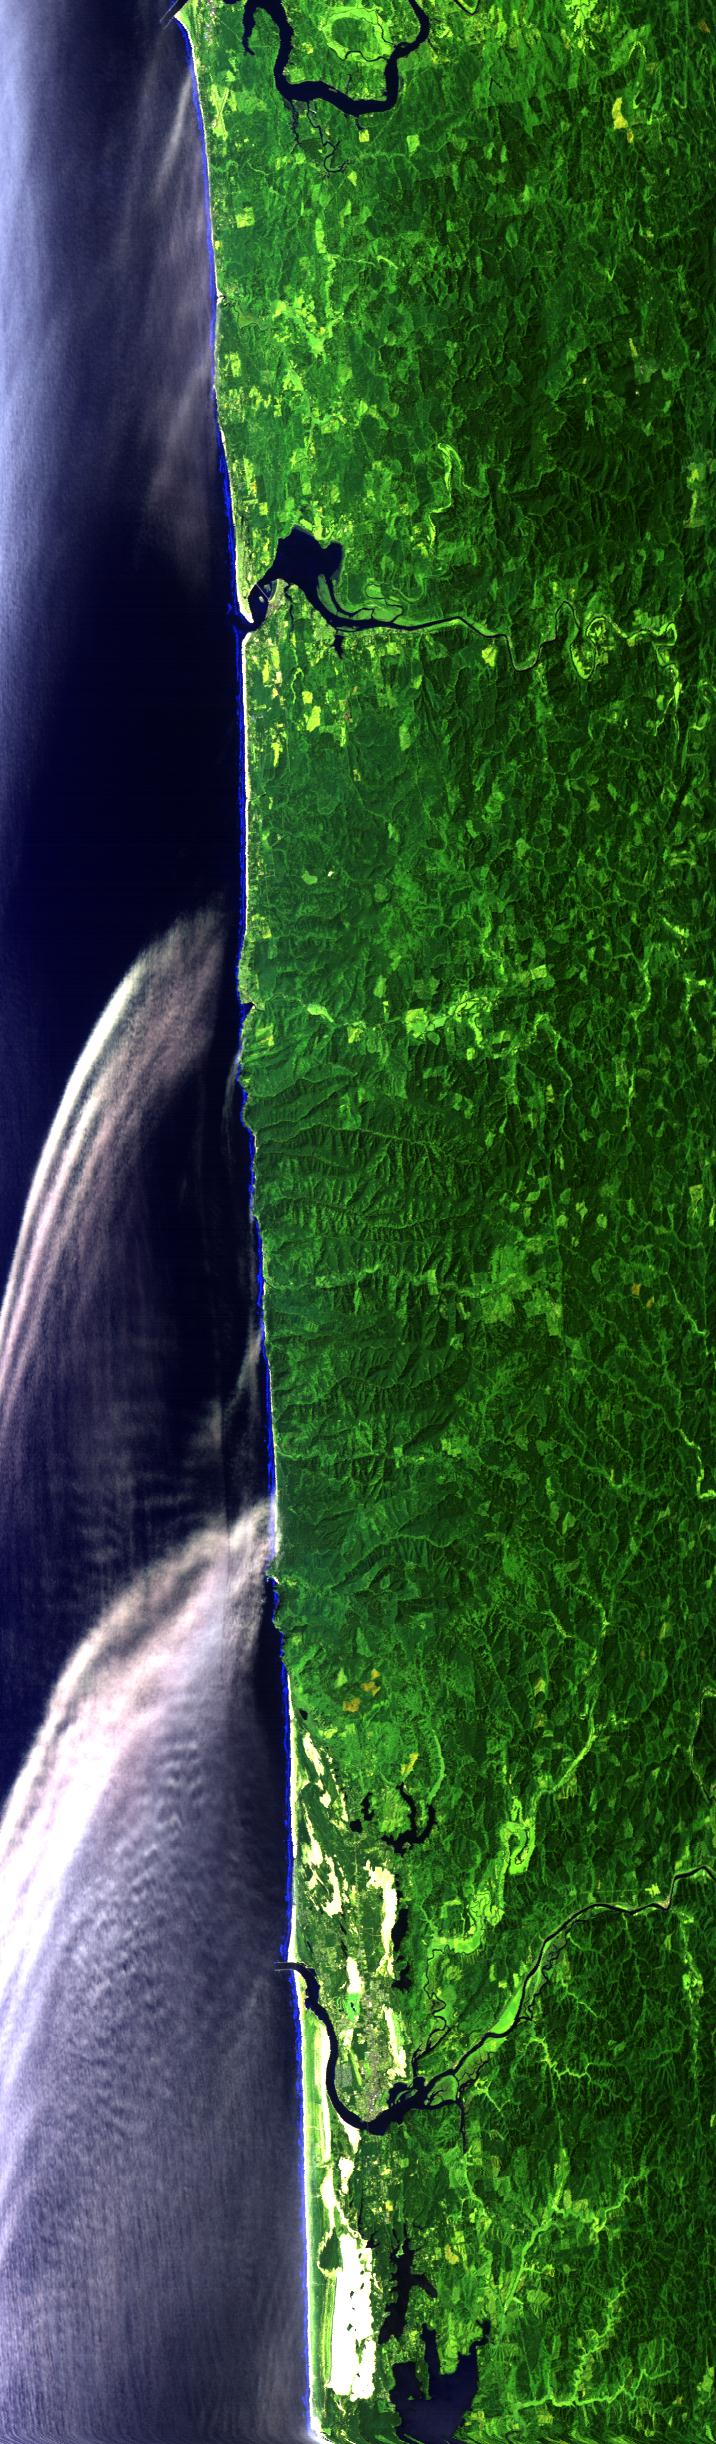
Sample Image

12 August 1996
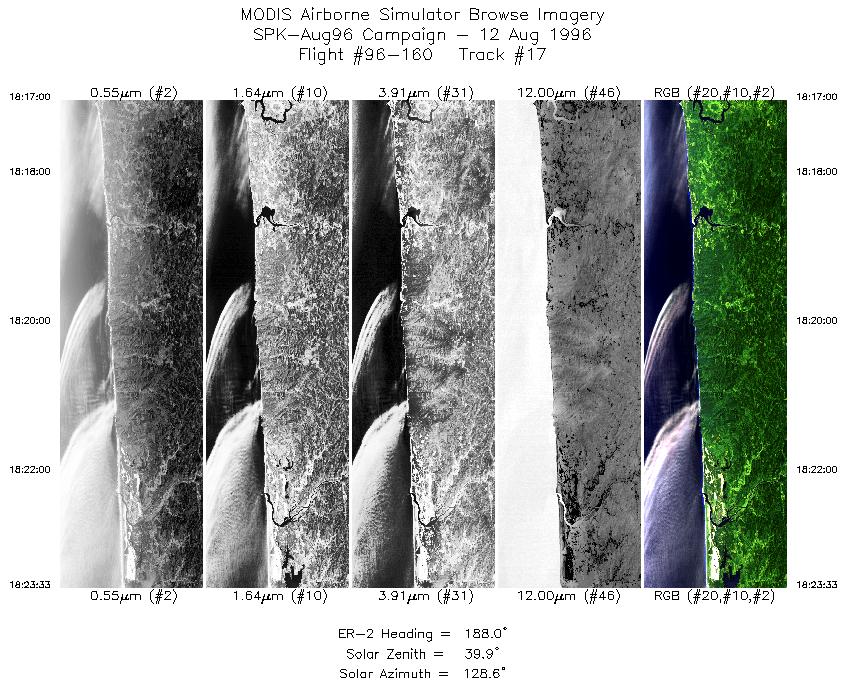
Track #17
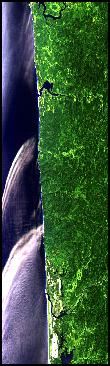
The Oregon coastline, begining over the Yaquina River, proceding south over the Alsea Bay, and ending over the Oregon Dunes National Recreation Area, the Siuslaw River, and Siltcoos Lake.
R: 2.15 microns
G: 1.65 microns
B: 0.47 microns
|
|
Mission Summary
Date: Aug 12, 1996
ER-2 Flight Number: 96-160
Deployment: Spokane-Aug96
Flight Location: Washington and Oregon
Principal Investigators: Dr. Susan Ustin (UCD), Dr. Andrew Bennett (MIT)
Additional Sensors: Dual 12" RC-10 (CIR, BW), AVIRIS
Objective: Data used to better understand biospheric-atmospheric interactions (Ustin).
Level-1B Processing Information
Level-1B Data processed by: Ames Research Center
Level-1B Data Version: #09
Level-1B Configuration: (sample file)
Calibration Type: Final
Calibration Version: 1.0
Temperature Adjustment: No
Status: Completed with final calibration
|
|
Flight Track Map

|
Level-1B Browse Imagery
Straight Line Flight Tracks: 31
Scanlines Processed: 76020
Solar Azimuth and Zenith Angles
|
Browse Images
|
Click on the Flight Track number to load images.
Lat/Lon ranges are for the BEG-END scanline nadir pixels.
|
Flight
Track |
Time_Span
(GMT) |
Heading
(Deg) |
Lat_Range
(Deg_N) |
Lon_Range
(Deg_W) |
Length
(Scanlines) |
Altitude
(Meters) |
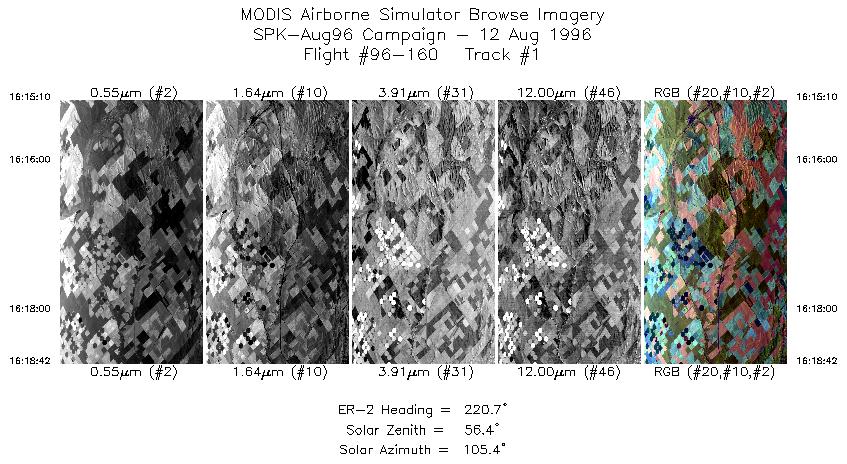
| 1 |
16:15-16:18 |
221 |
46.97-46.71 |
118.54-118.84 |
1320 |
~20000 |
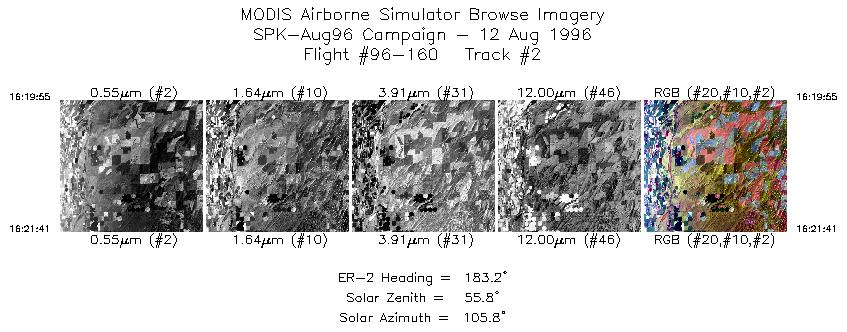
| 2 |
16:19-16:21 |
183 |
46.59-46.40 |
118.90-118.90 |
661 |
~20000 |
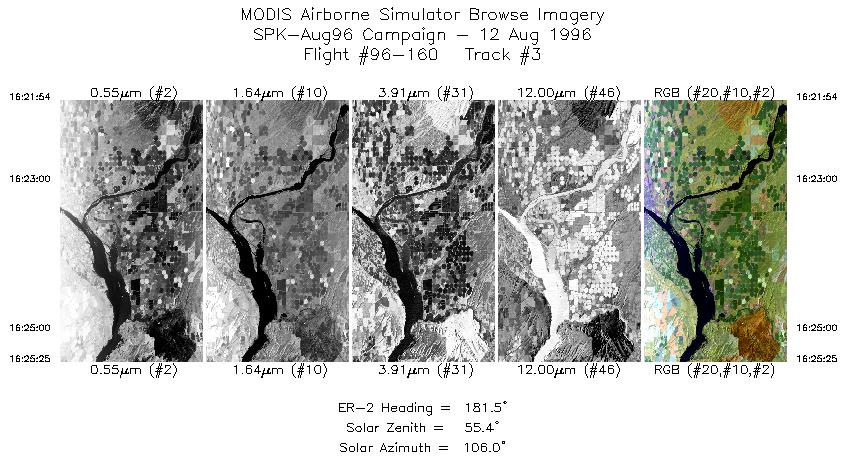
| 3 |
16:21-16:25 |
182 |
46.38-45.99 |
118.90-118.90 |
1313 |
~20000 |
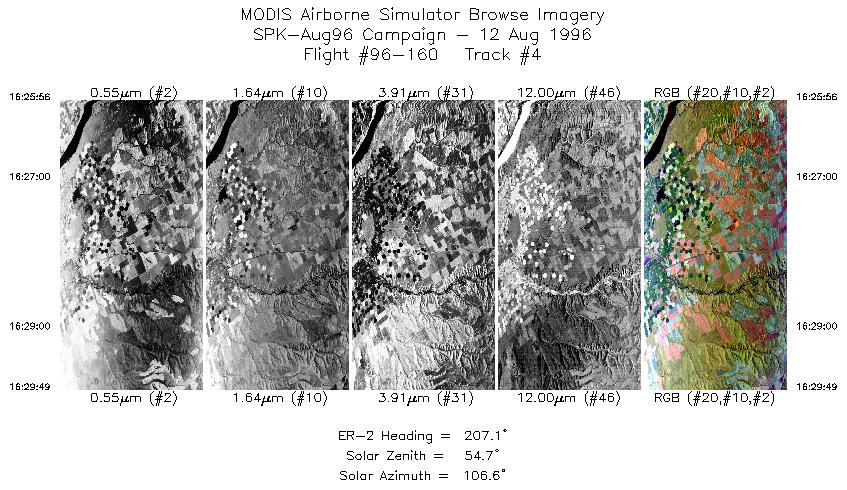
| 4 |
16:25-16:29 |
207 |
45.94-45.56 |
118.92-119.20 |
1451 |
~20000 |
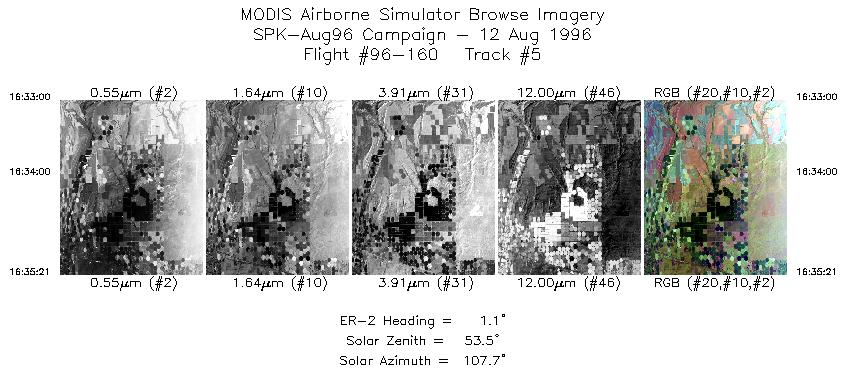
| 5 |
16:33-16:35 |
1 |
45.57-45.83 |
119.55-119.55 |
879 |
~20000 |
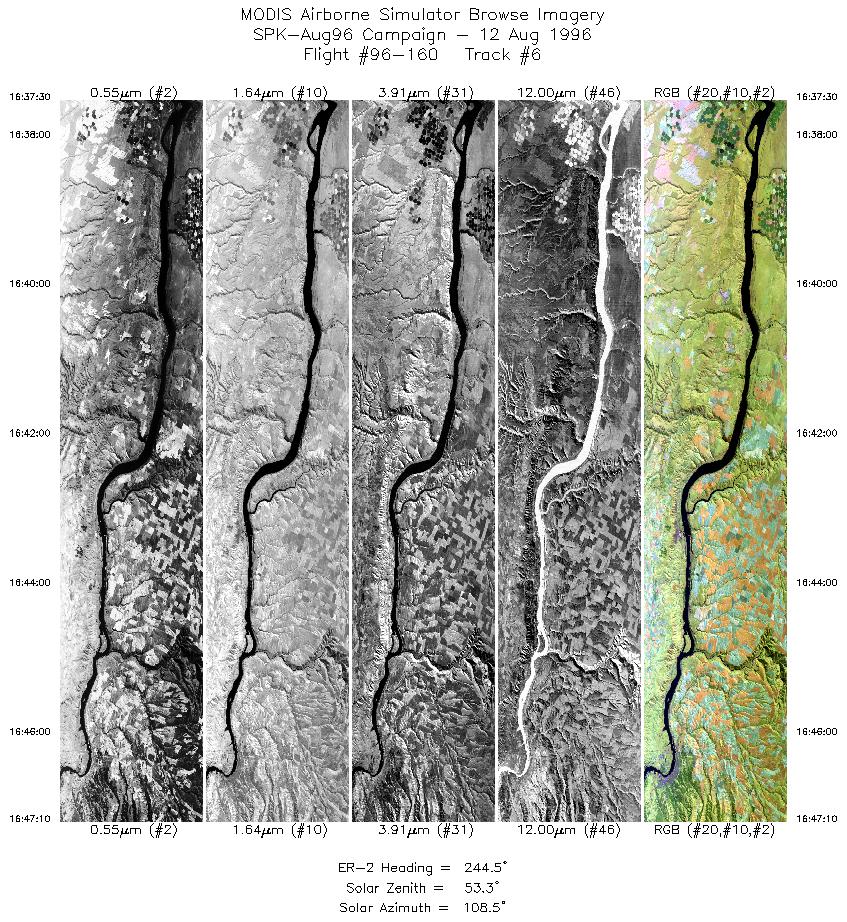
| 6 |
16:37-16:47 |
245 |
45.94-45.49 |
119.80-121.22 |
3610 |
~20000 |
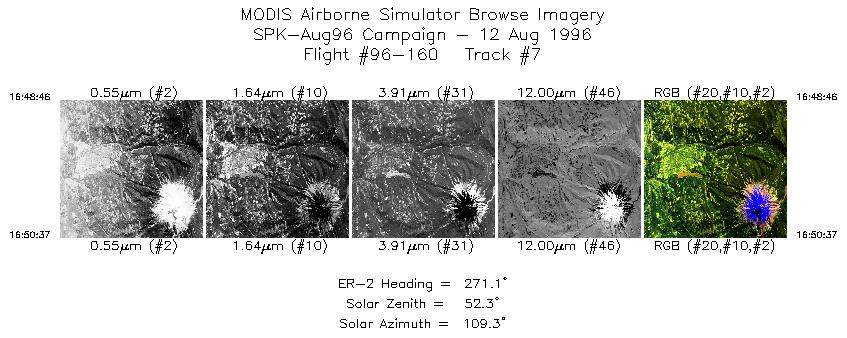
| 7 |
16:48-16:50 |
271 |
45.44-45.44 |
121.47-121.76 |
691 |
~20000 |
| 8 |
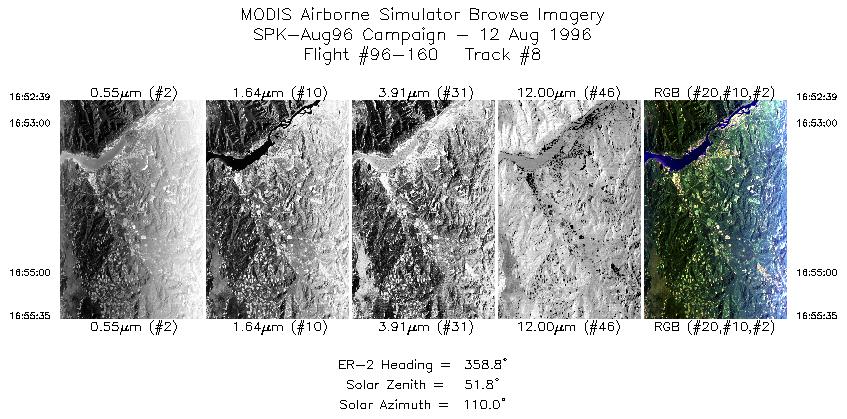
16:52-16:55 |
359 |
45.60-45.94 |
121.93-121.93 |
1096 |
~20000 |
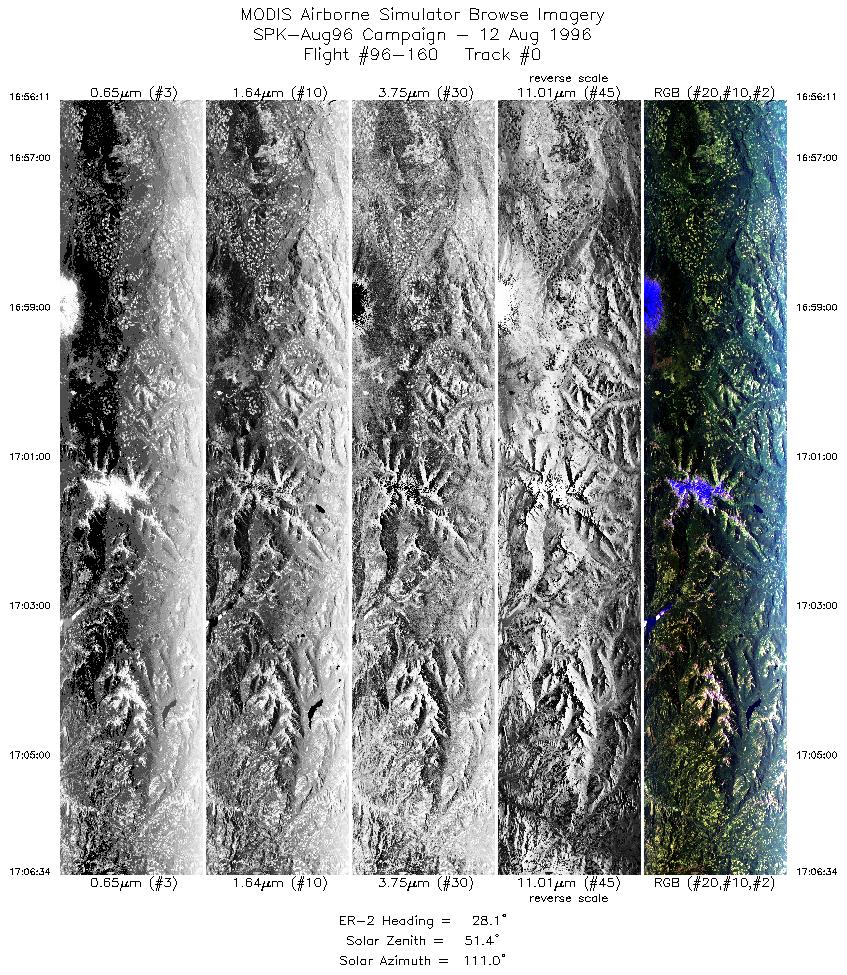
| 9 |
16:56-17:06 |
28 |
46.00-47.04 |
121.91-121.07 |
3876 |
~20000 |
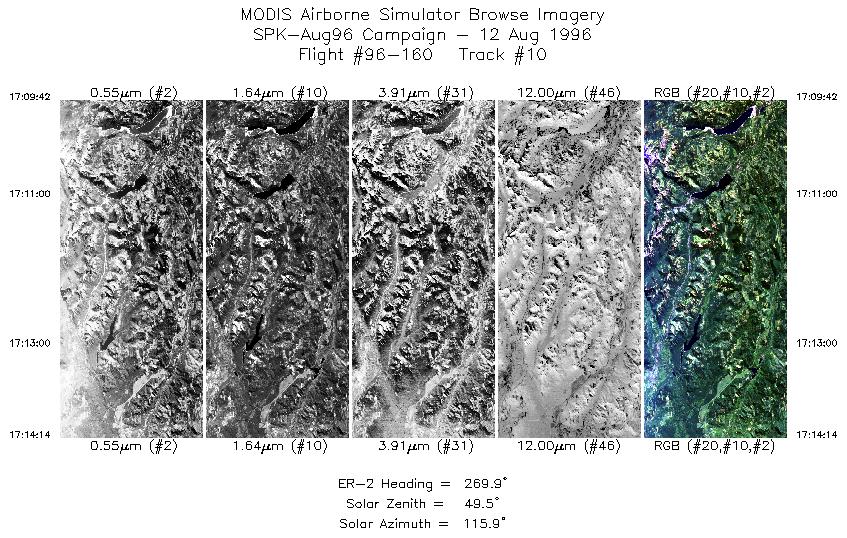
| 10 |
17:09-17:14 |
270 |
47.34-47.34 |
121.17-121.91 |
1692 |
~20000 |
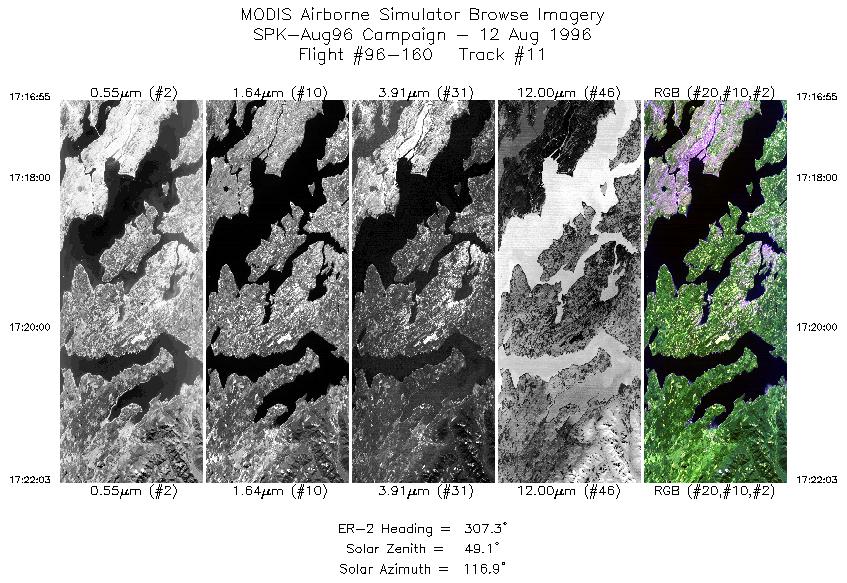
| 11 |
17:16-17:22 |
307 |
47.50-47.86 |
122.28-122.97 |
1916 |
~20000 |
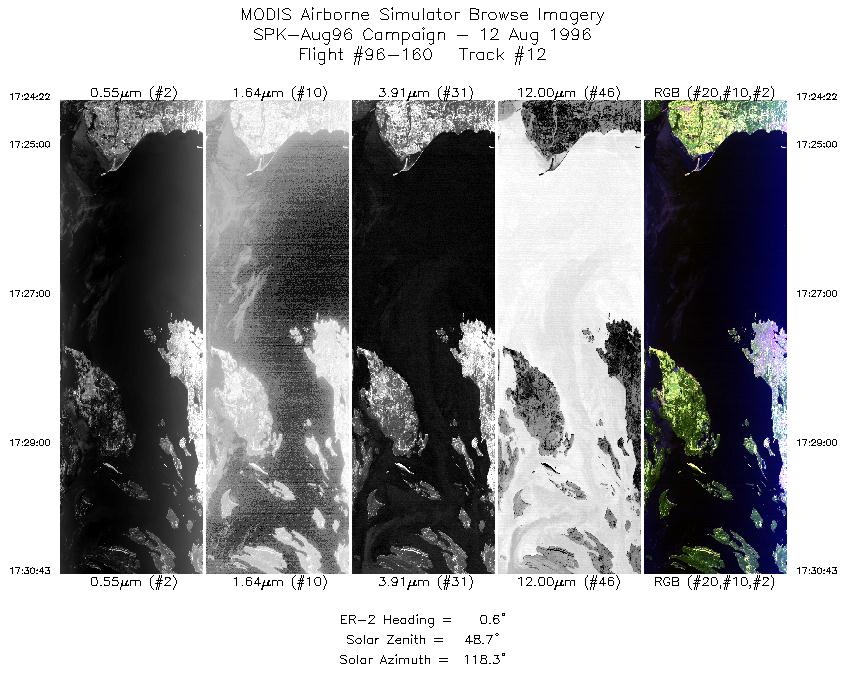
| 12 |
17:24-17:30 |
1 |
48.06-48.80 |
123.20-123.20 |
2370 |
~20000 |
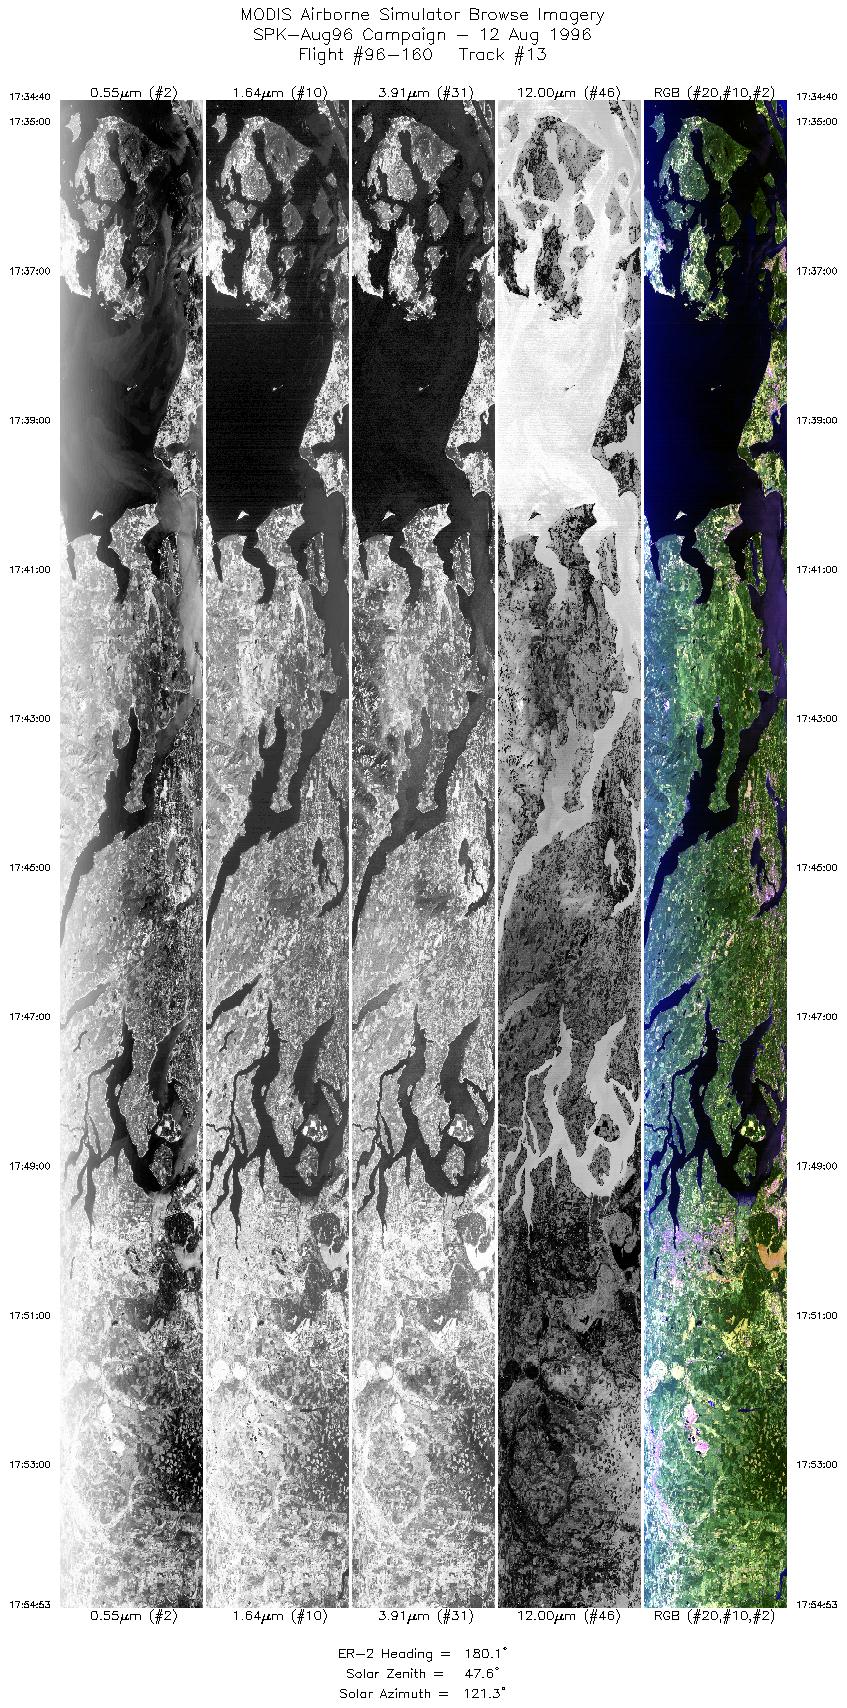
| 13 |
17:34-17:54 |
180 |
48.75-46.49 |
122.84-122.76 |
7543 |
~20000 |
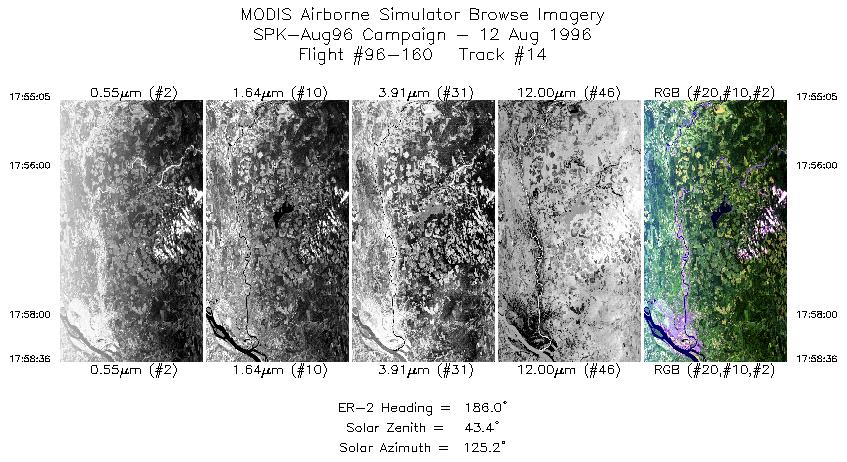
| 14 |
17:55-17:58 |
186 |
46.46-46.07 |
122.76-122.83 |
1313 |
~20000 |
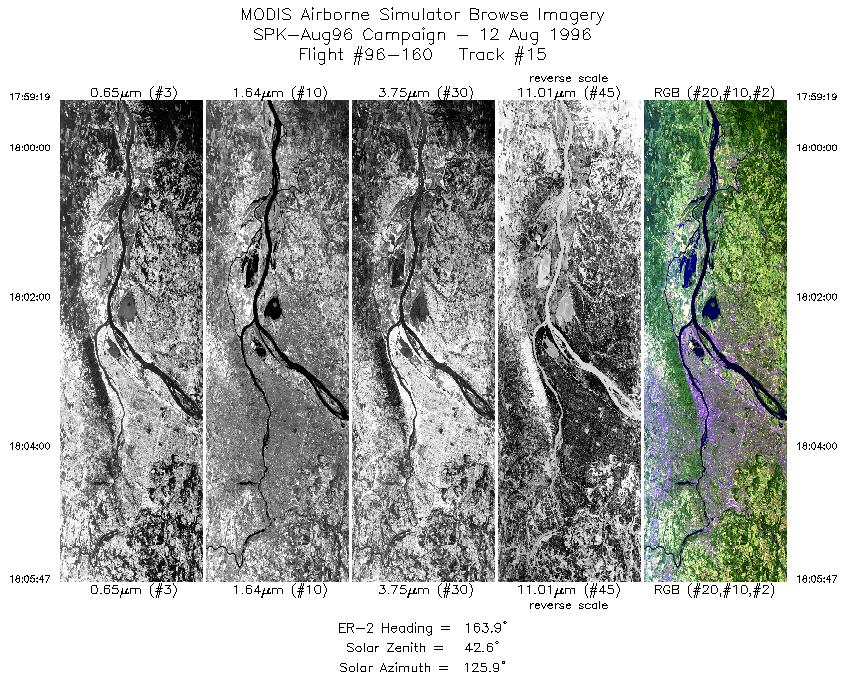
| 15 |
17:59-18:05 |
164 |
45.99-45.28 |
122.82-122.54 |
2413 |
~20000 |
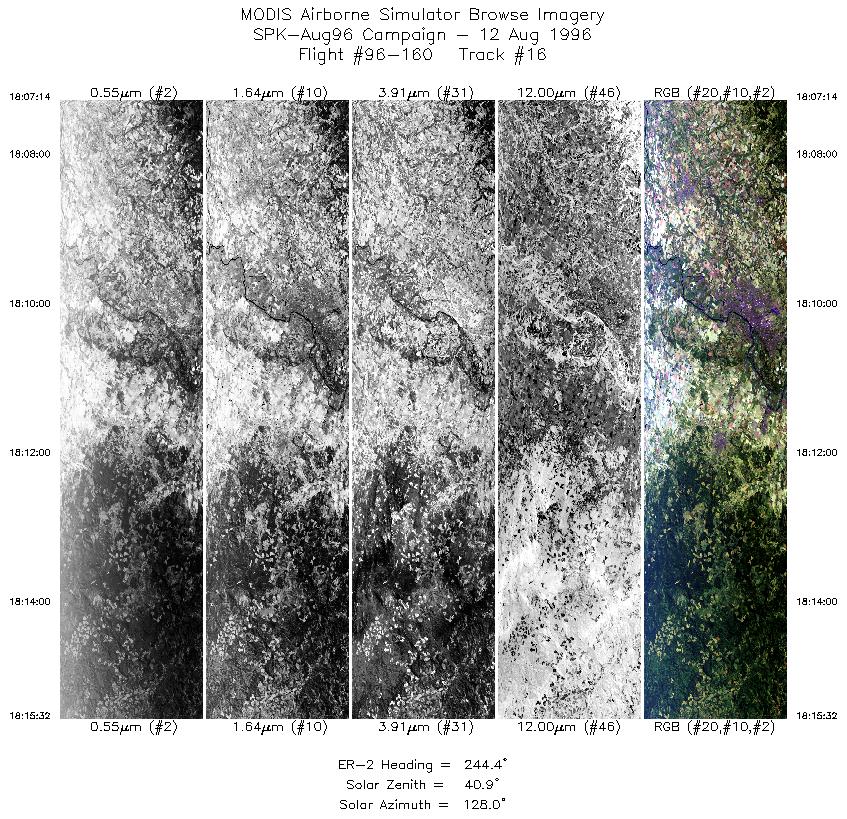
| 16 |
18:07-18:15 |
244 |
45.15-44.74 |
122.64-123.86 |
3097 |
~20000 |
| 17 |
18:17-18:23 |
188 |
44.61-43.87 |
123.98-124.13 |
2444 |
~20000 |
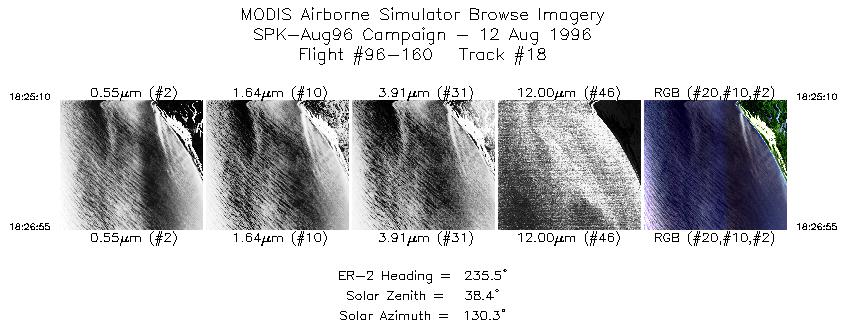
| 18 |
18:25-18:26 |
236 |
43.71-43.60 |
124.22-124.45 |
654 |
~20000 |
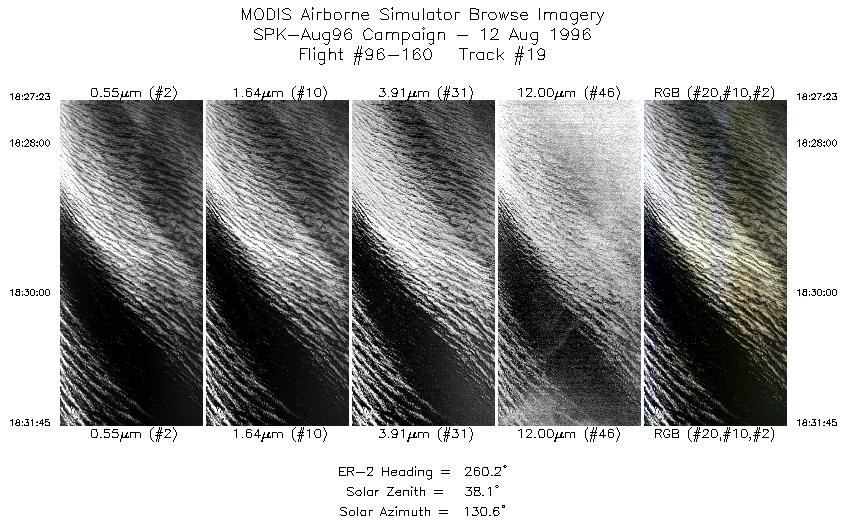
| 19 |
18:27-18:31 |
260 |
43.58-43.51 |
124.52-125.20 |
1630 |
~20000 |
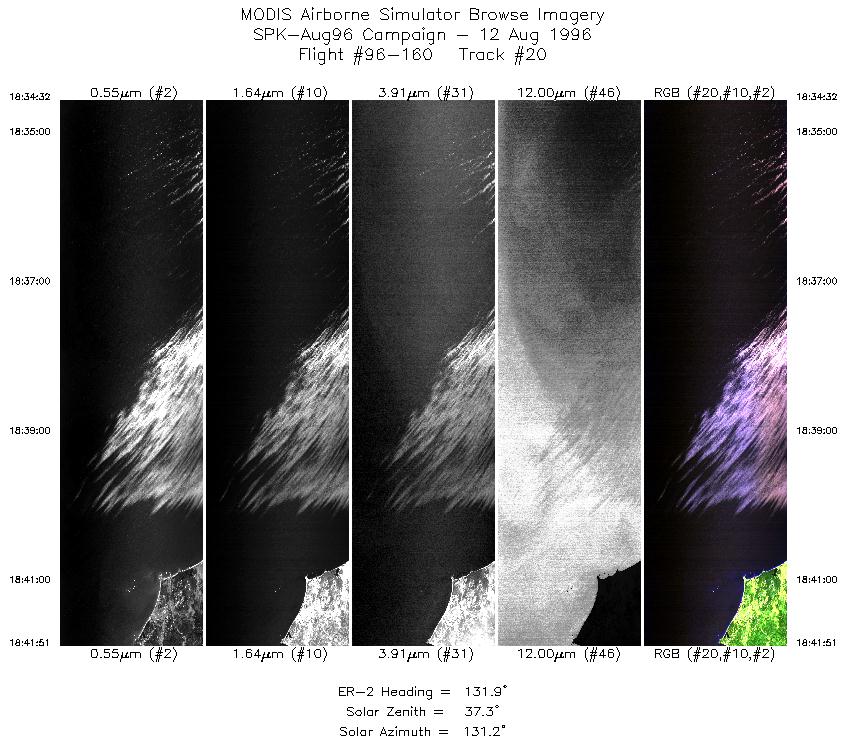
| 20 |
18:34-18:41 |
132 |
43.28-42.73 |
125.34-124.51 |
2730 |
~20000 |
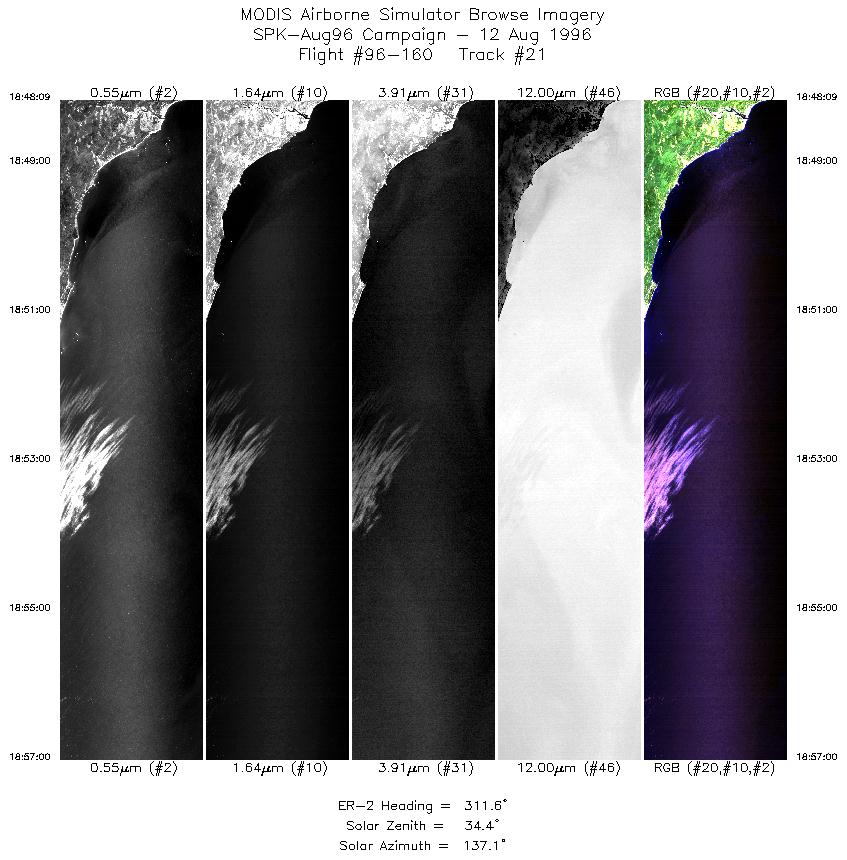
| 21 |
18:48-18:57 |
312 |
42.45-43.12 |
124.34-125.38 |
3304 |
~20000 |
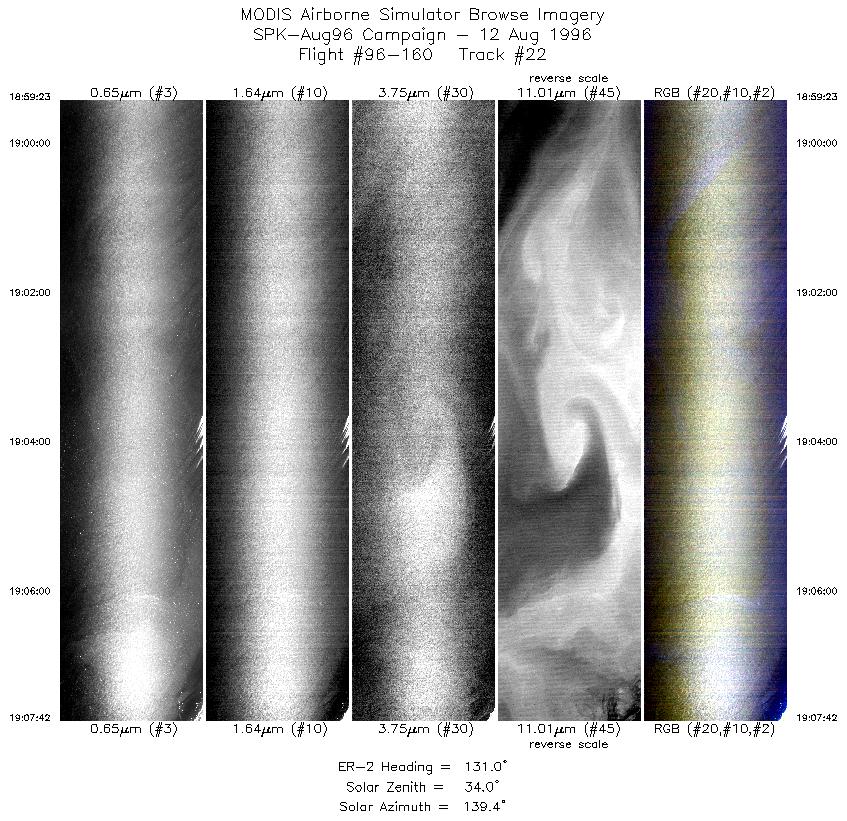
| 22 |
18:59-19:07 |
131 |
42.98-42.36 |
125.49-124.54 |
3107 |
~20000 |
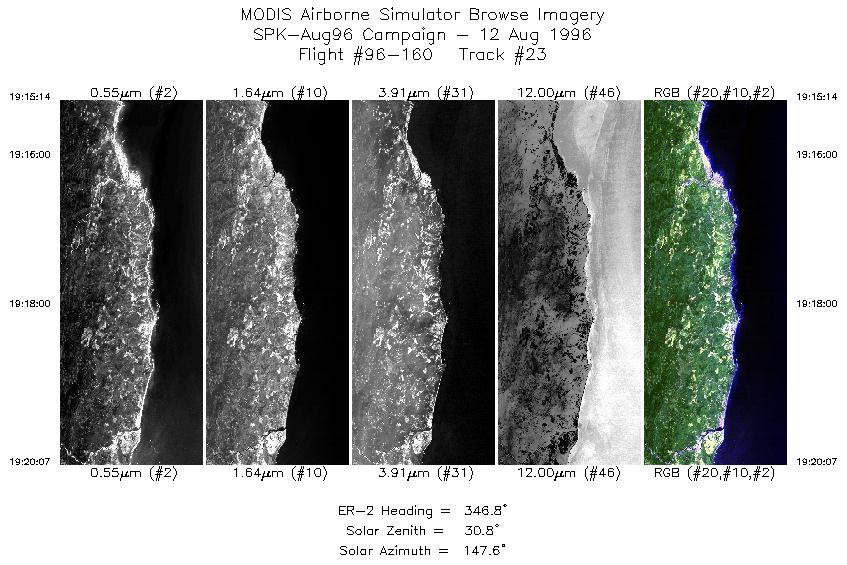
| 23 |
19:15-19:20 |
347 |
41.94-42.48 |
124.25-124.43 |
1825 |
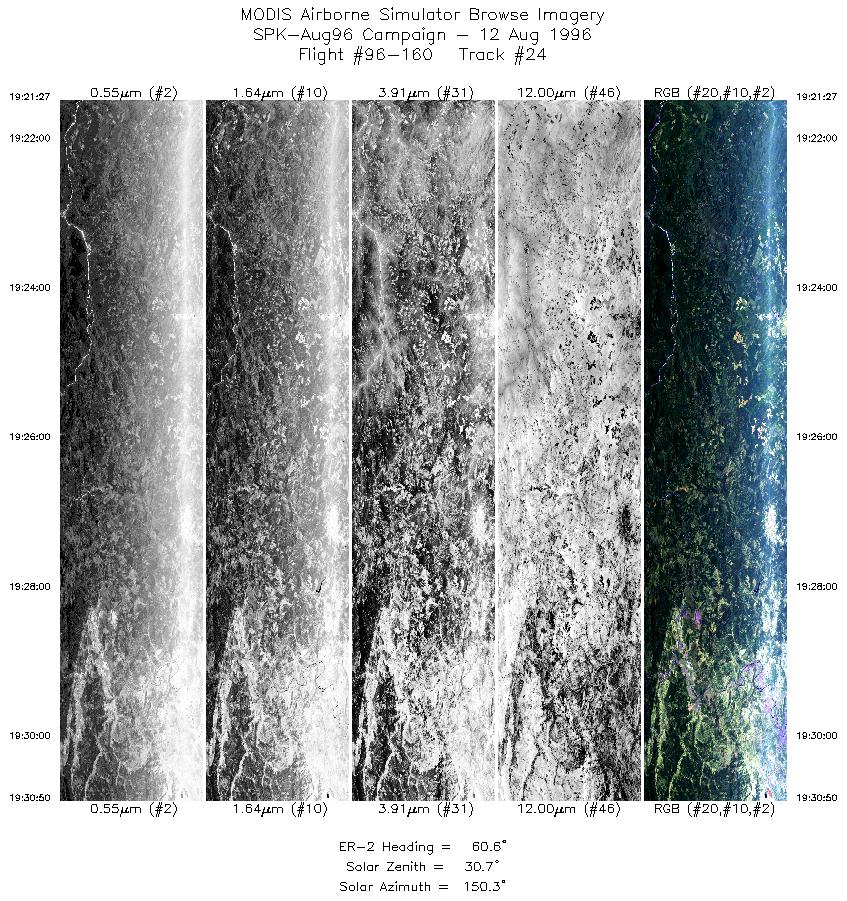
~20000 |
| 24 |
19:21-19:30 |
61 |
42.61-43.13 |
124.37-123.14 |
3509 |
~20000 |
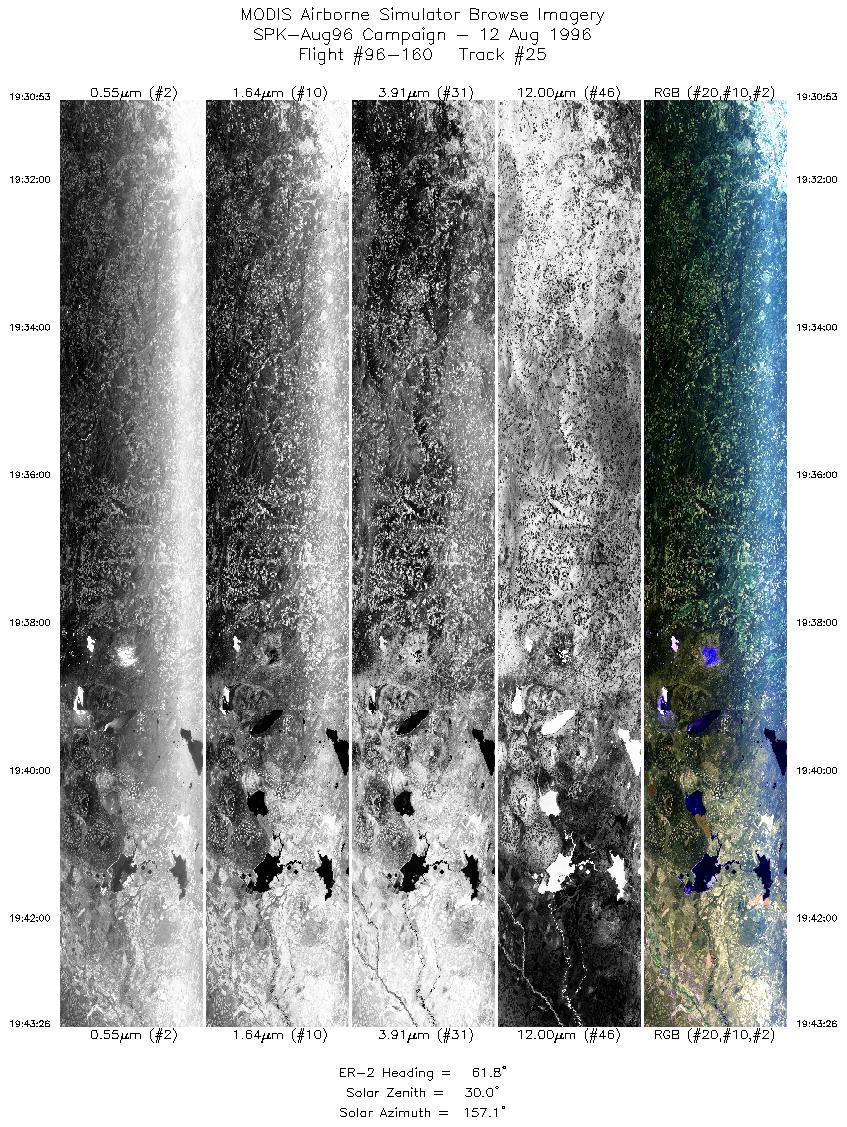
| 25 |
19:30-19:43 |
62 |
43.14-43.81 |
123.14-121.47 |
4639 |
~20000 |
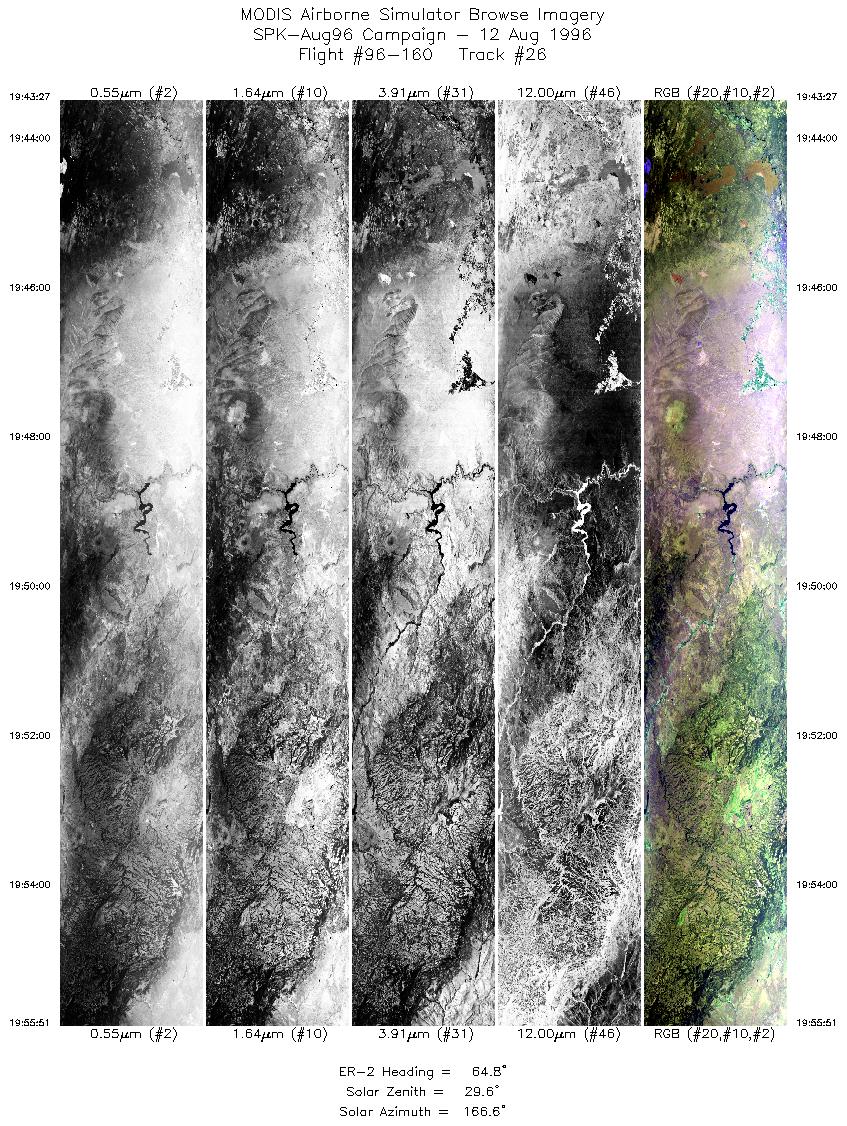
| 26 |
19:43-19:55 |
65 |
43.81-44.47 |
121.48-119.76 |
4630 |
~20000 |
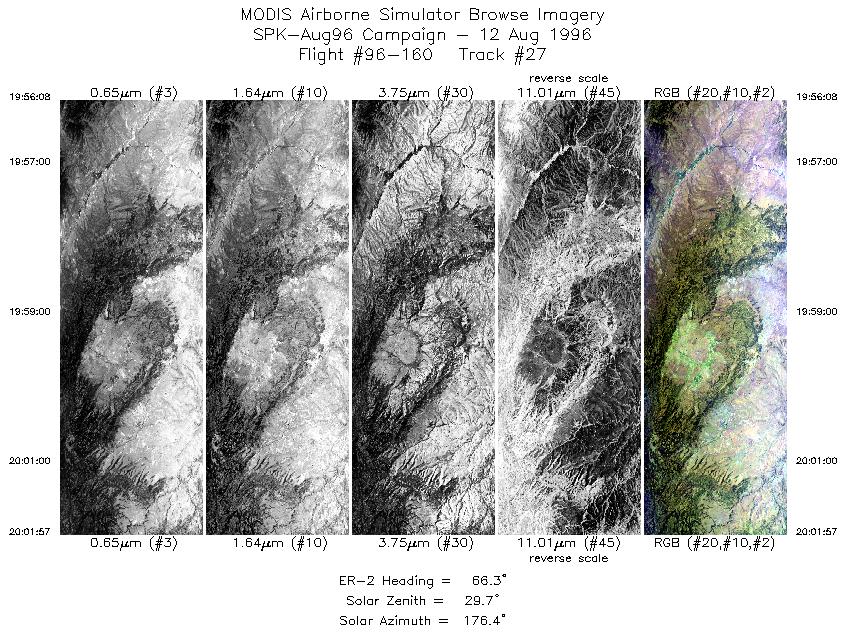
| 27 |
19:56-20:01 |
66 |
44.49-44.79 |
119.72-118.89 |
2178 |
~20000 |
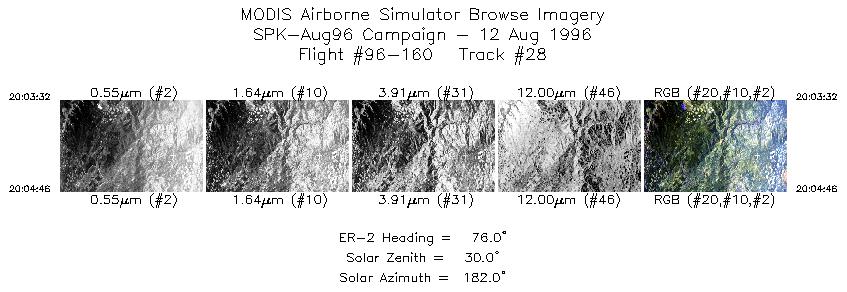
| 28 |
20:03-20:04 |
76 |
44.84-44.88 |
118.64-118.45 |
463 |
~20000 |
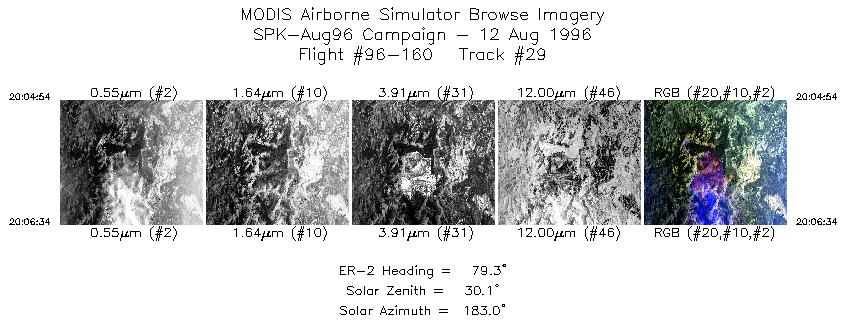
| 29 |
20:04-20:06 |
79 |
44.88-44.92 |
118.43-118.17 |
625 |
~20000 |
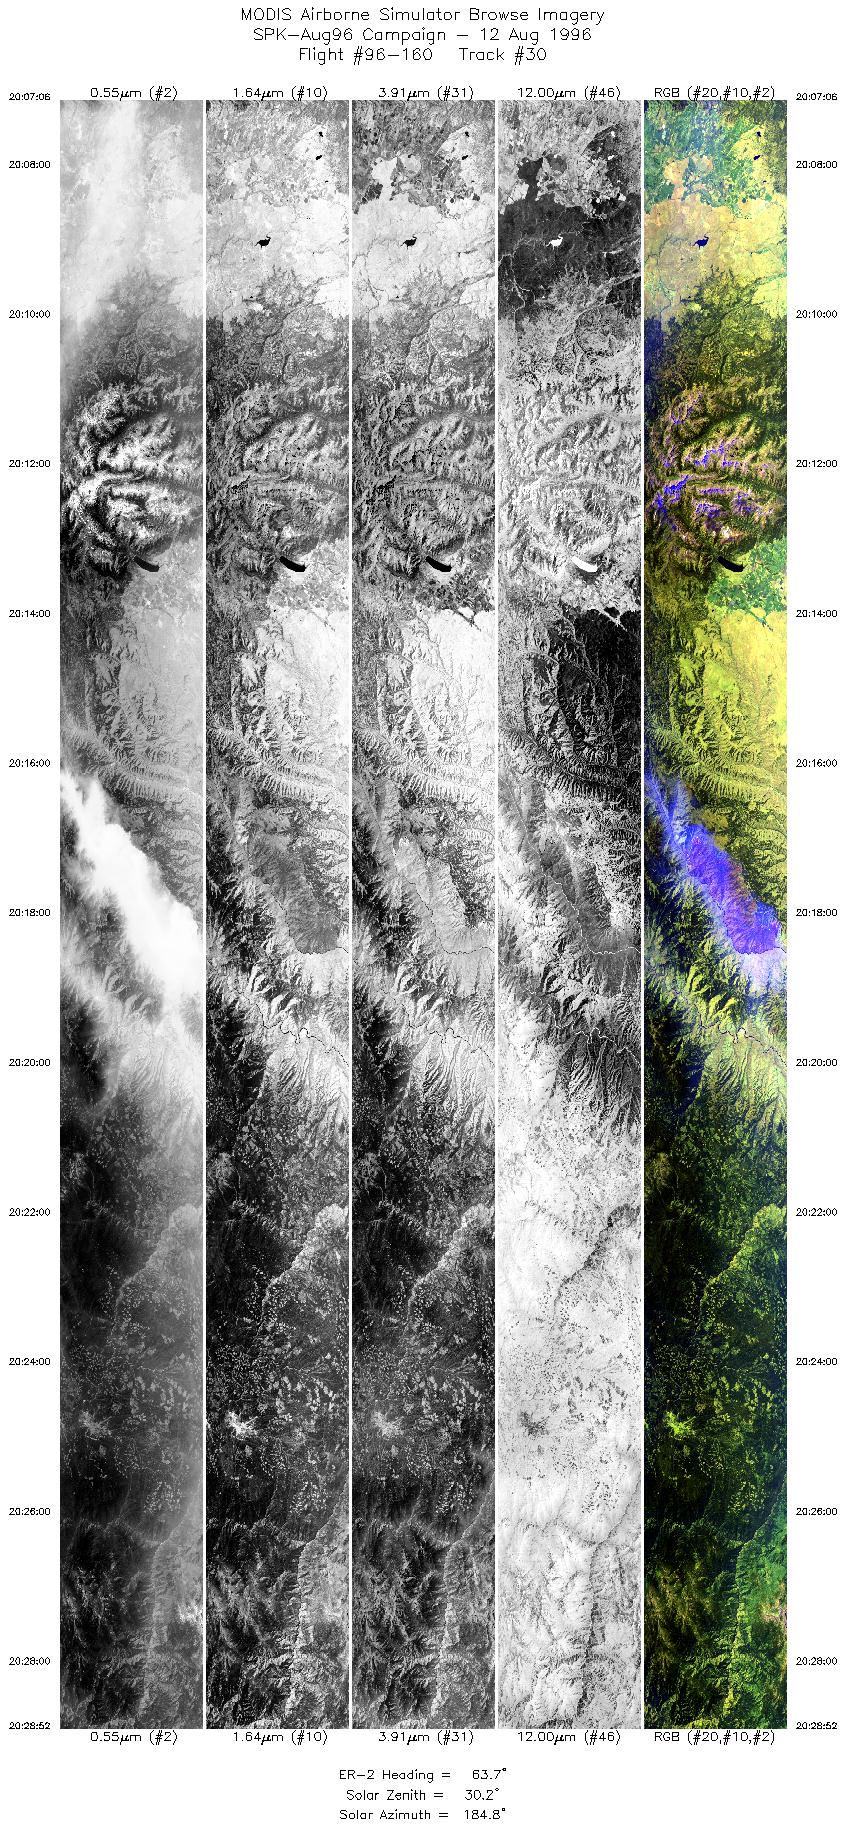
| 30 |
20:07-20:28 |
64 |
44.95-46.13 |
118.11-114.90 |
8148 |
~20000 |
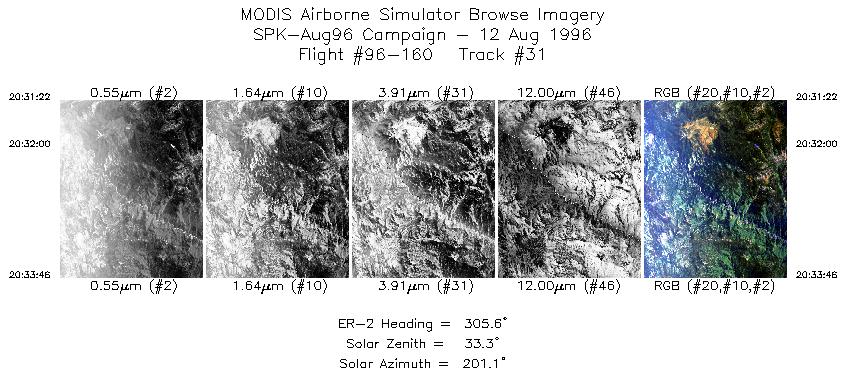
| 31 |
20:31-20:33 |
306 |
46.35-46.51 |
114.91-115.23 |
893 |
~20000 |
|
Images 01 through 31 in sequence |
Data Evalutation
All data is nominal, except for some smearing at start of flightlines. Track
31 has single white band across flightline at approximately scanline 518.
Spectral Summary
Spectral Band Configuration
Spectral Response Files
Level-1B Data Distribution
NASA Goddard Space Flight Center DAAC
Related Web Sites
JPL AVIRIS Web Page
Airborne Sensors Facility Page
NASA ER-2 Aircraft Program
|
|