
|
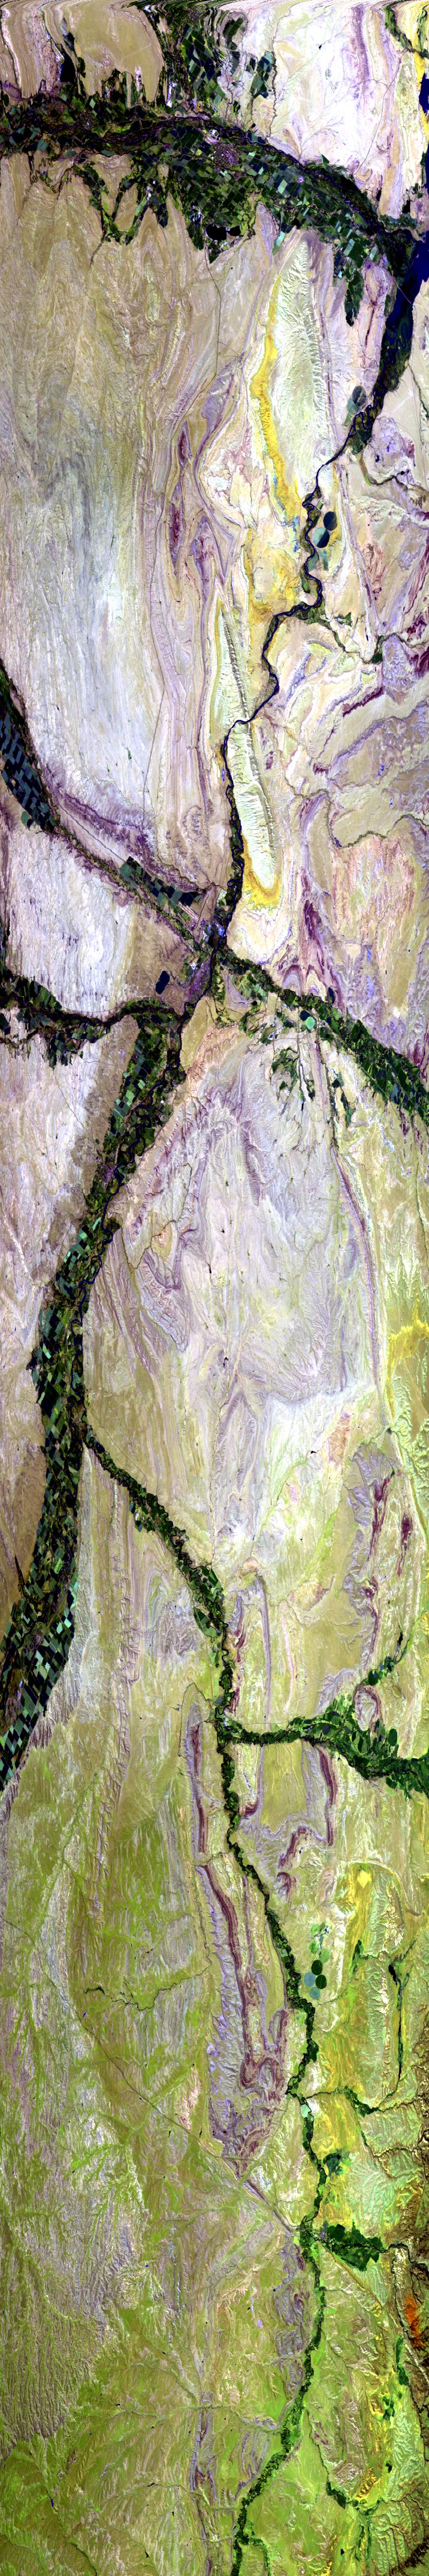
Sample Image

07 August 1996
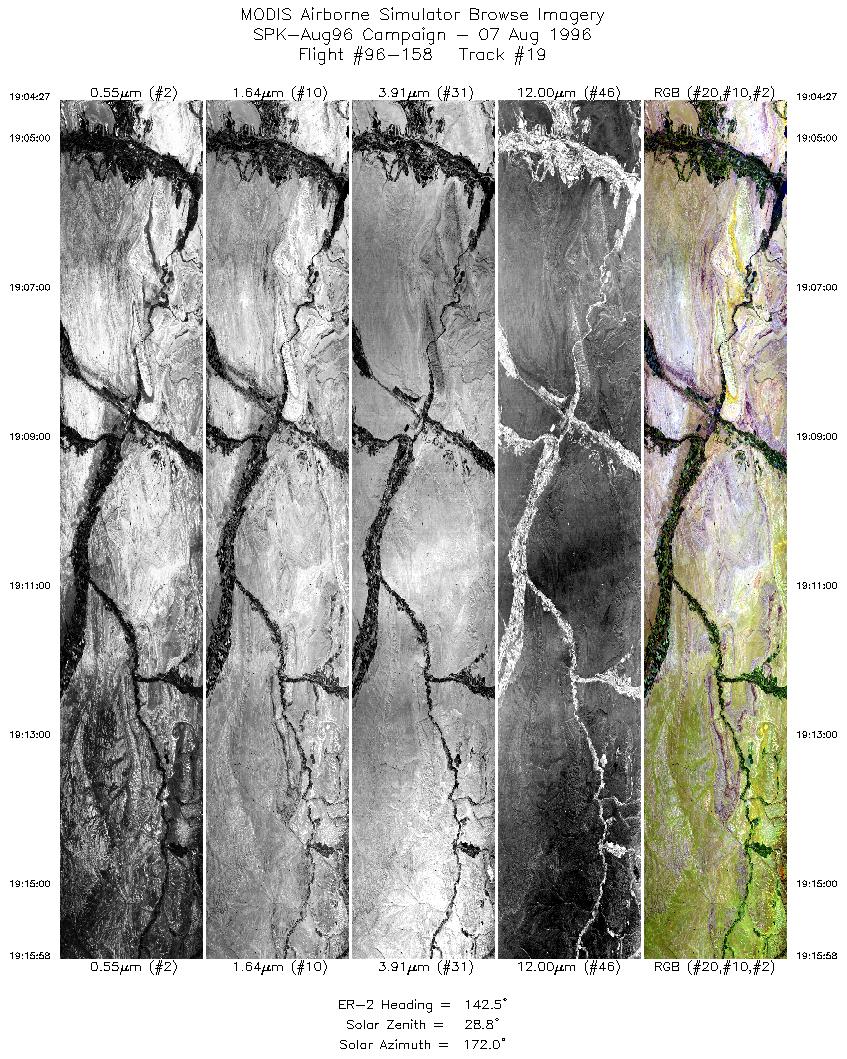
Track #19


Flightline begins over Bighorn Lake, Wyoming, and proceeds south, following the Bighorn River.
R: 2.15 microns
G: 1.65 microns
B: 0.47 microns
|
|
Mission Summary
Date: Aug 07, 1996
ER-2 Flight Number: 96-158
Deployment: Spokane-Aug96
Flight Location: Yellowstone, Rattlesnake Hills, Bighorn Basin, WY; Idaho and Montana
Principal Investigators: Dr. Fred Kruse (AIG), Dr. Roger Clark (USGS)
Additional Sensors: Dual 12" RC-10 (CIR, BW), AVIRIS
Objective: Support Shuttle Imaging Radar in developing data sets for lithographic mapping (Kruse). Assist the National Park Service in aquiring information concerning soil and rock composition; vegitation type, density, and vigor; animal and plant habitat; anthropological impact; and other ecological data (Clark).
Level-1B Processing Information
Level-1B Data processed by: Ames Research Center
Level-1B Data Version: #09
Level-1B Configuration: (sample file)
Calibration Type: Final
Calibration Version: 1.0
Temperature Adjustment: No
Status: Completed with final calibration
|
|
Flight Track Map

|
Level-1B Browse Imagery
Straight Line Flight Tracks: 24
Scanlines Processed: 71475
Solar Azimuth and Zenith Angles
|
Browse Images
|
Click on the Flight Track number to load images.
Lat/Lon ranges are for the BEG-END scanline nadir pixels.
|
Flight
Track |
Time_Span
(GMT) |
Heading
(Deg) |
Lat_Range
(Deg_N) |
Lon_Range
(Deg_W) |
Length
(Scanlines) |
Altitude
(Meters) |
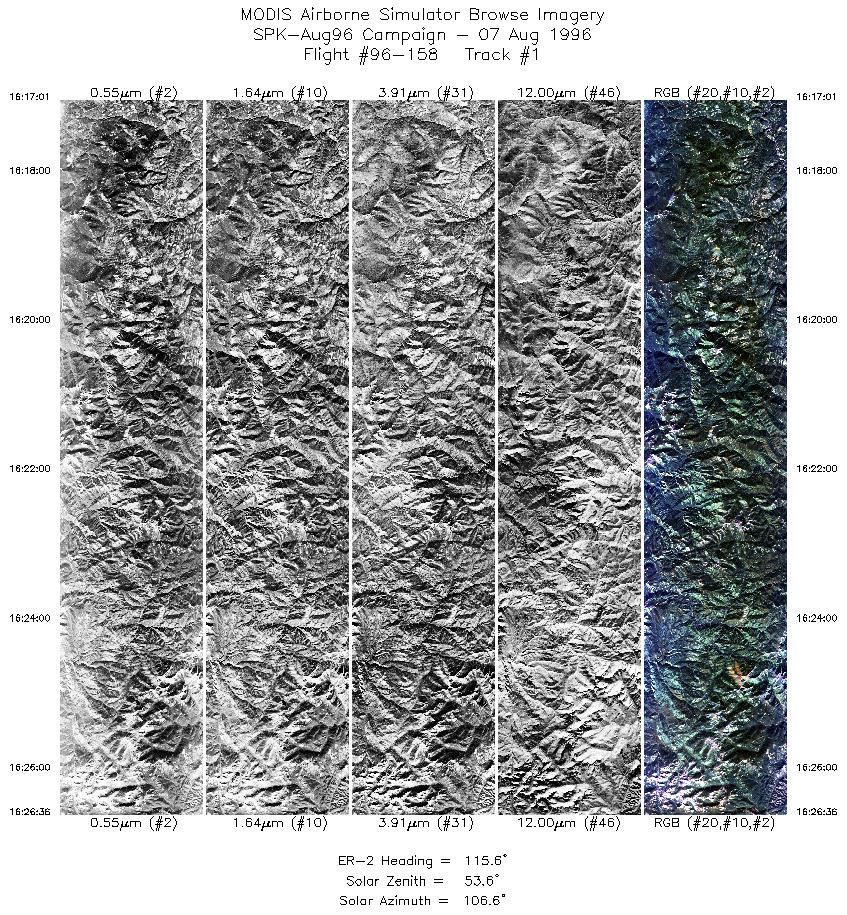
| 1 |
16:17-16:26 |
116 |
47.21-46.74 |
116.14-114.69 |
3576 |
~20000 |
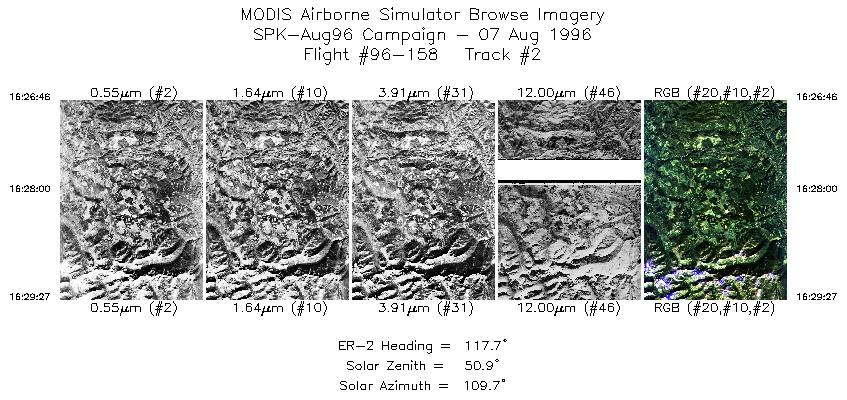
| 2 |
16:26-16:29 |
118 |
46.73-46.59 |
114.66-114.24 |
1003 |
~20000 |
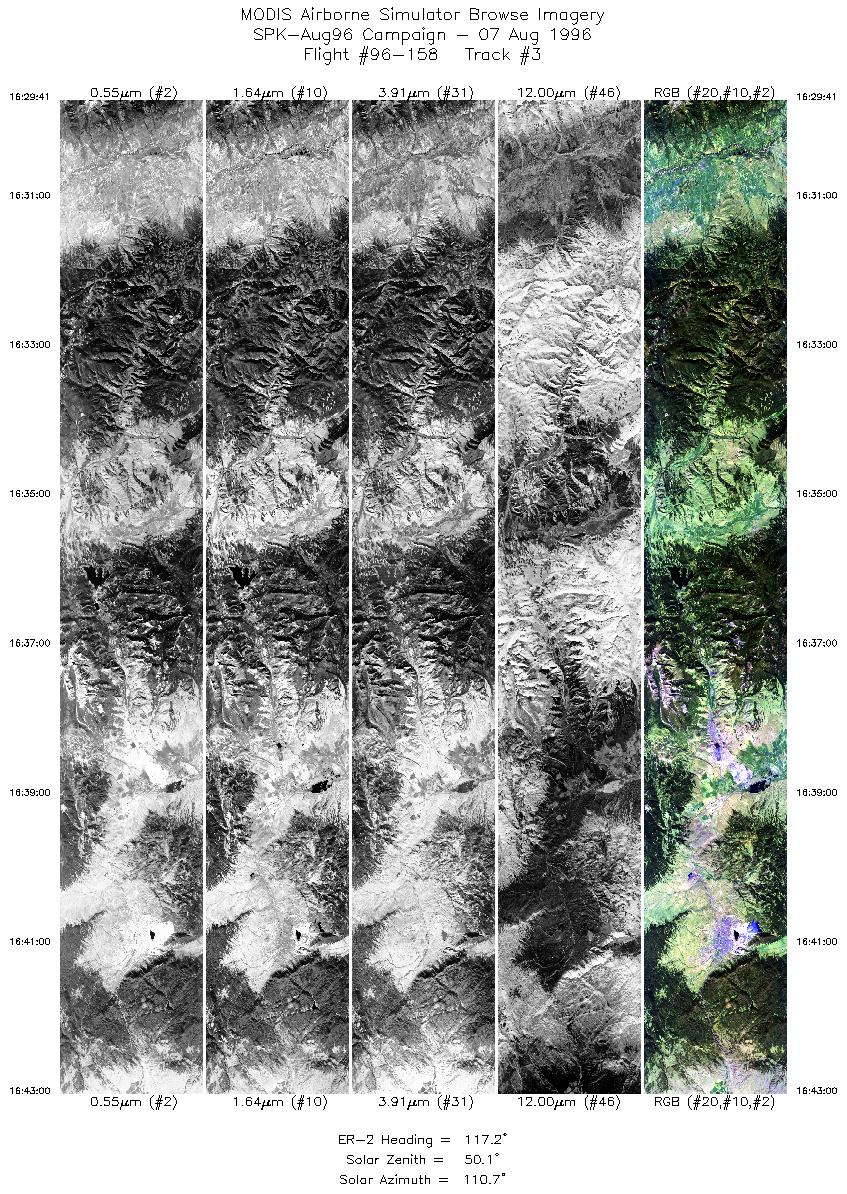
| 3 |
16:29-16:43 |
117 |
46.58-45.88 |
114.20-112.21 |
4971 |
~20000 |
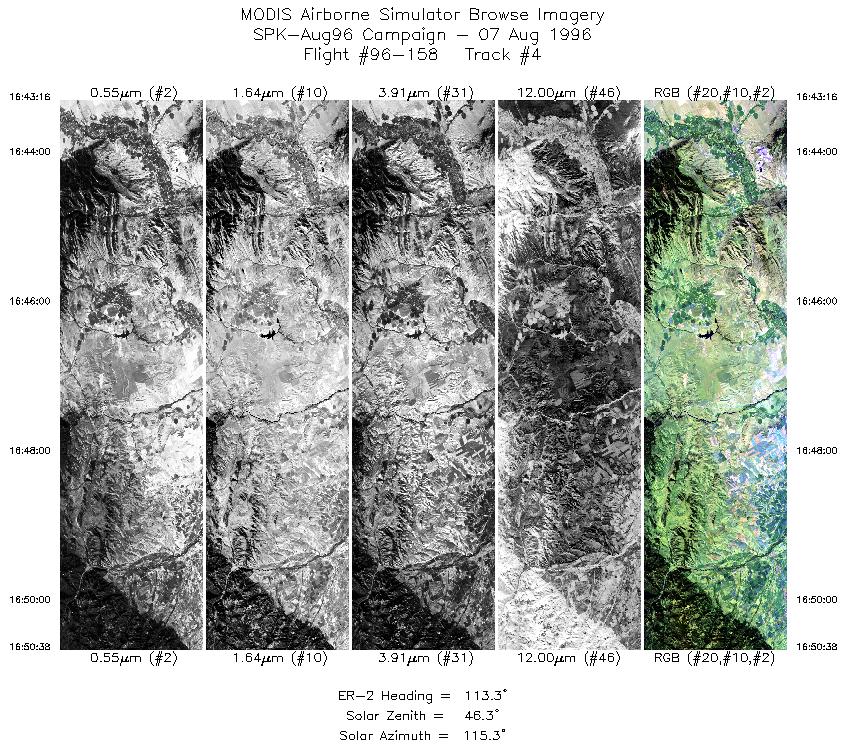
| 4 |
16:43-16:50 |
113 |
45.86-45.51 |
112.17-111.06 |
2750 |
~20000 |
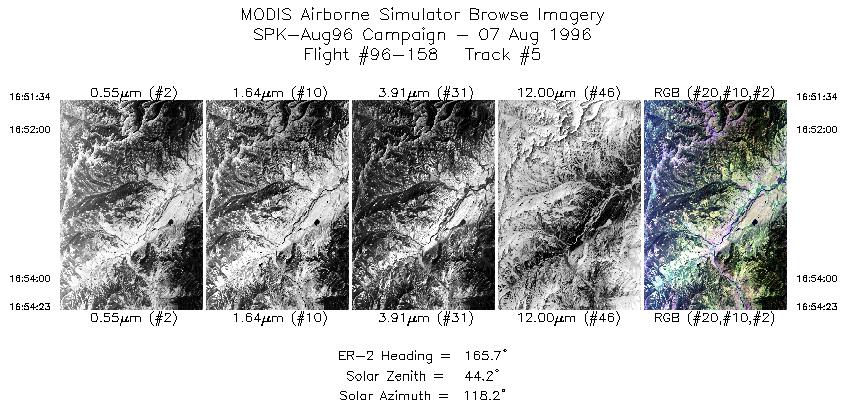
| 5 |
16:51-16:54 |
166 |
45.43-45.12 |
110.96-110.86 |
1052 |
~20000 |
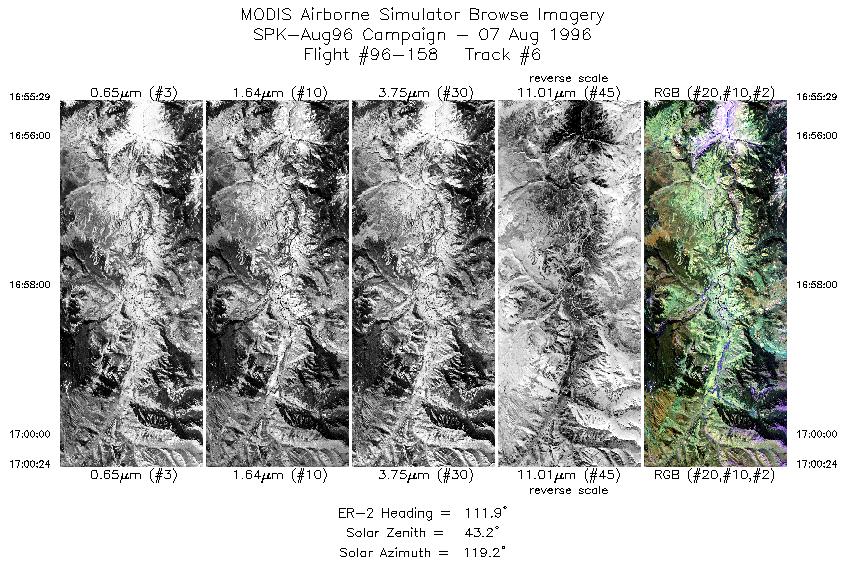
| 6 |
16:55-17:00 |
112 |
45.03-44.83 |
110.76-110.03 |
1836 |
~20000 |
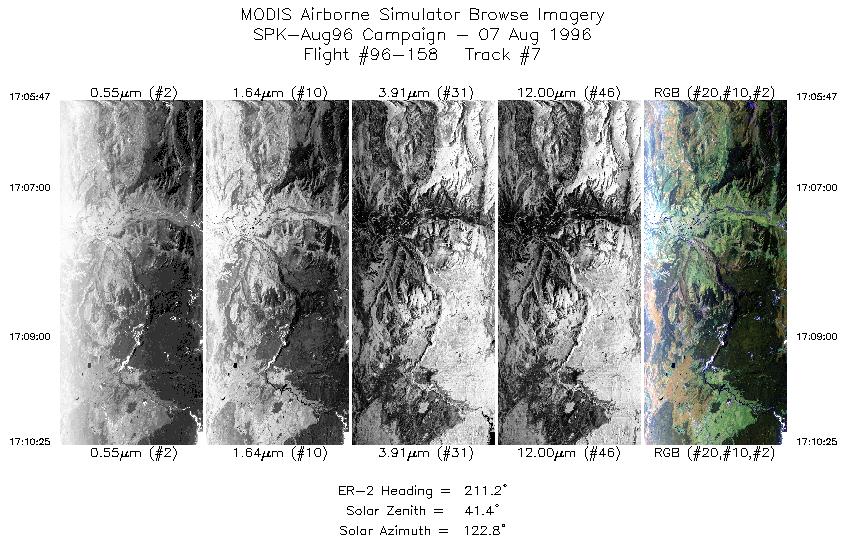
| 7 |
17:05-17:10 |
211 |
45.06-44.61 |
110.17-110.55 |
1729 |
~20000 |
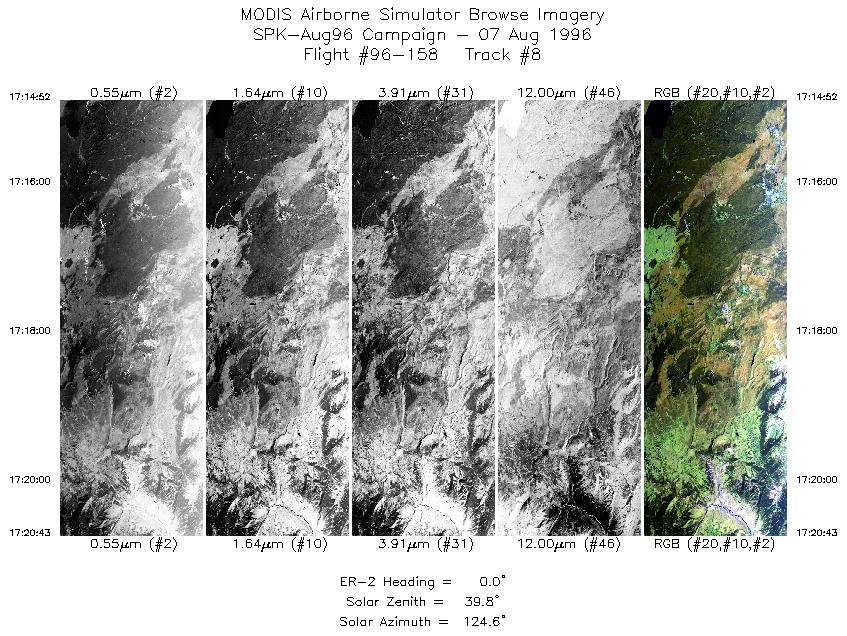
| 8 |
17:14-17:20 |
0 |
44.42-45.07 |
110.69-110.69 |
2183 |
~20000 |
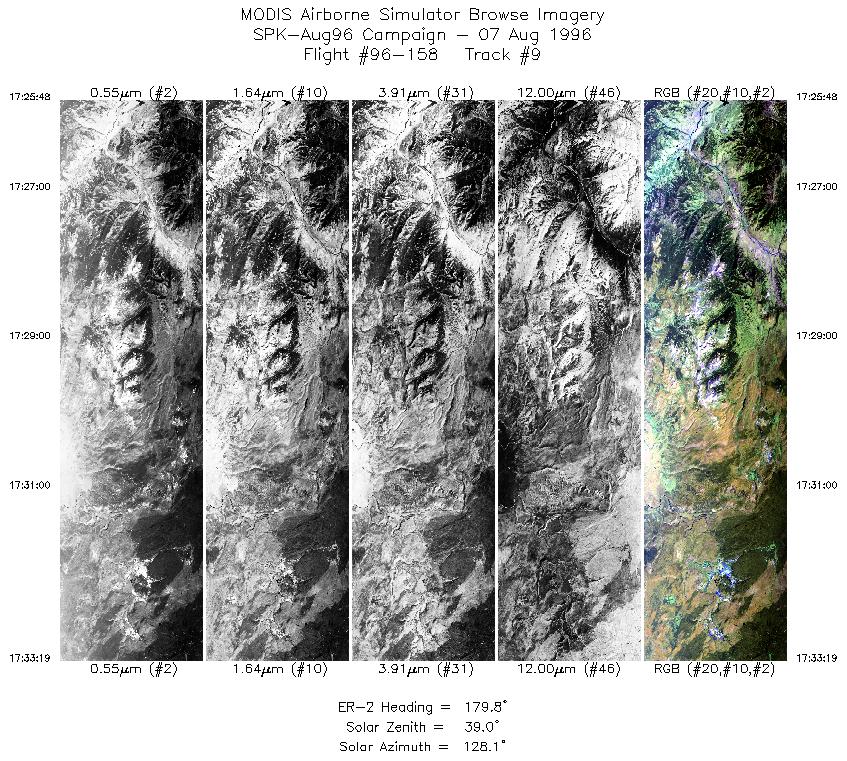
| 9 |
17:25-17:33 |
180 |
45.26-44.42 |
110.83-110.84 |
2805 |
~20000 |
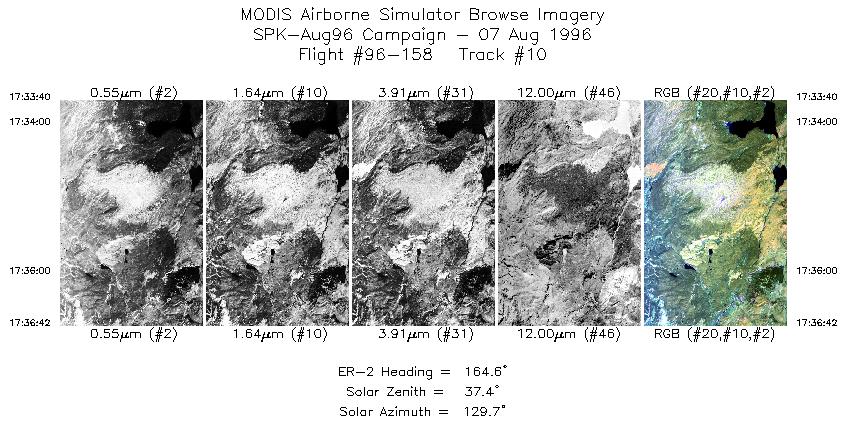
| 10 |
17:33-17:36 |
165 |
44.38-44.05 |
110.83-110.71 |
1133 |
~20000 |
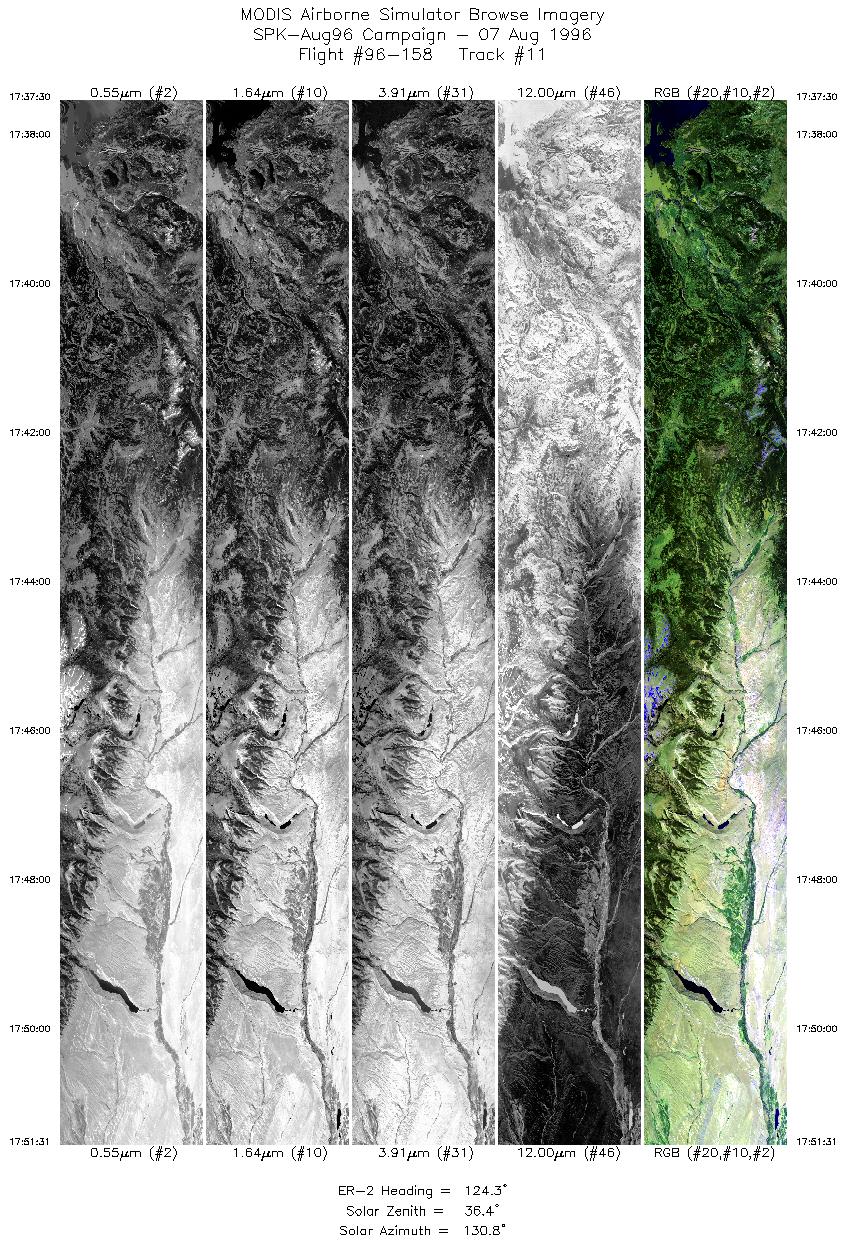
| 11 |
17:37-17:51 |
124 |
43.99-43.09 |
110.64-108.81 |
5229 |
~20000 |
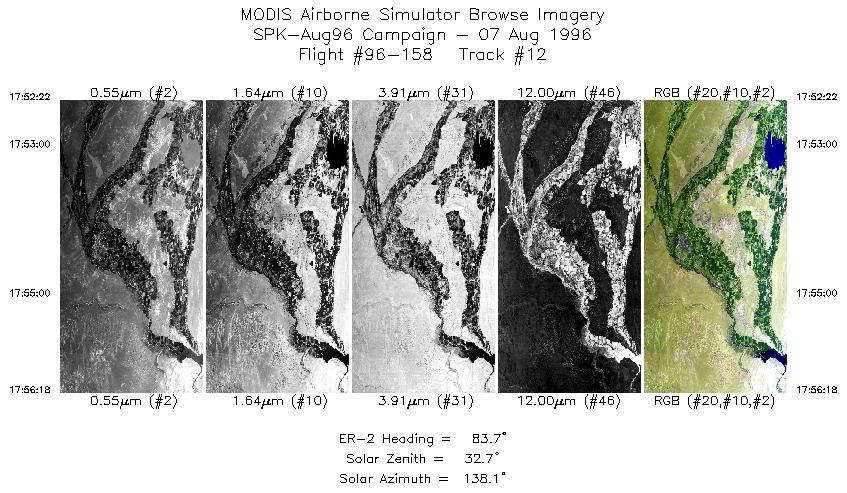
| 12 |
17:52-17:56 |
84 |
43.06-43.11 |
108.69-108.09 |
1467 |
~20000 |
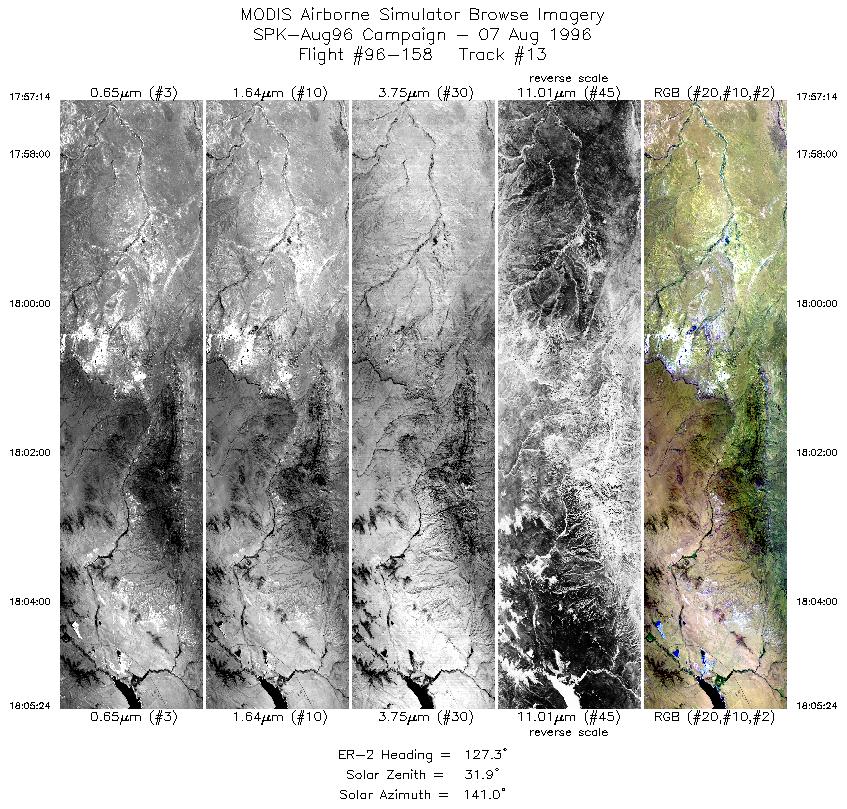
| 13 |
17:57-18:05 |
127 |
43.08-42.52 |
107.96-106.96 |
3046 |
~20000 |
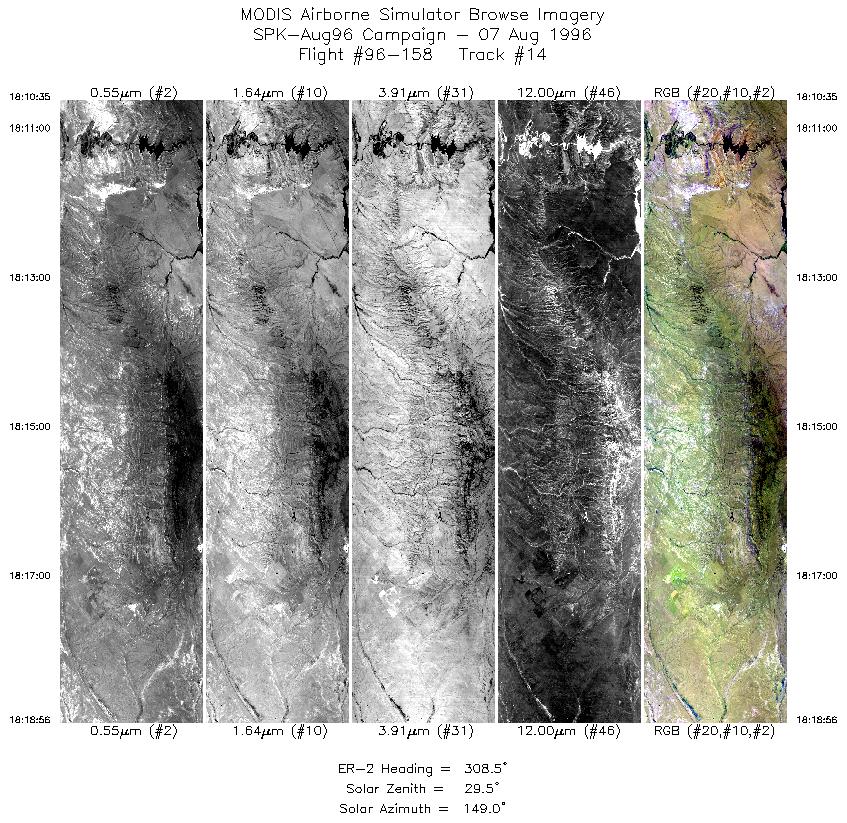
| 14 |
18:10-18:18 |
308 |
42.51-43.11 |
106.65-107.67 |
3115 |
~20000 |
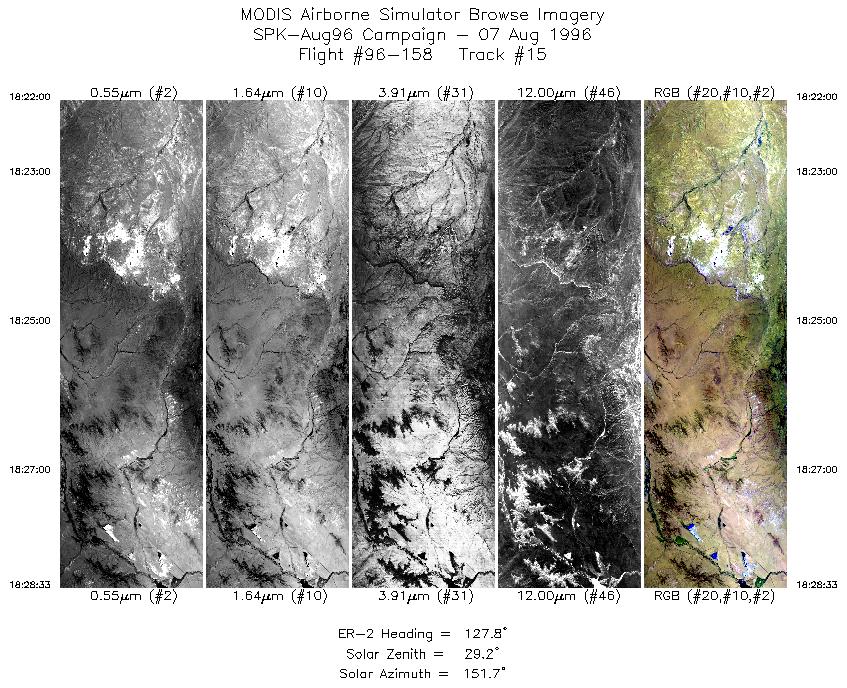
| 15 |
18:22-18:28 |
128 |
42.95-42.48 |
107.84-107.06 |
2444 |
~20000 |
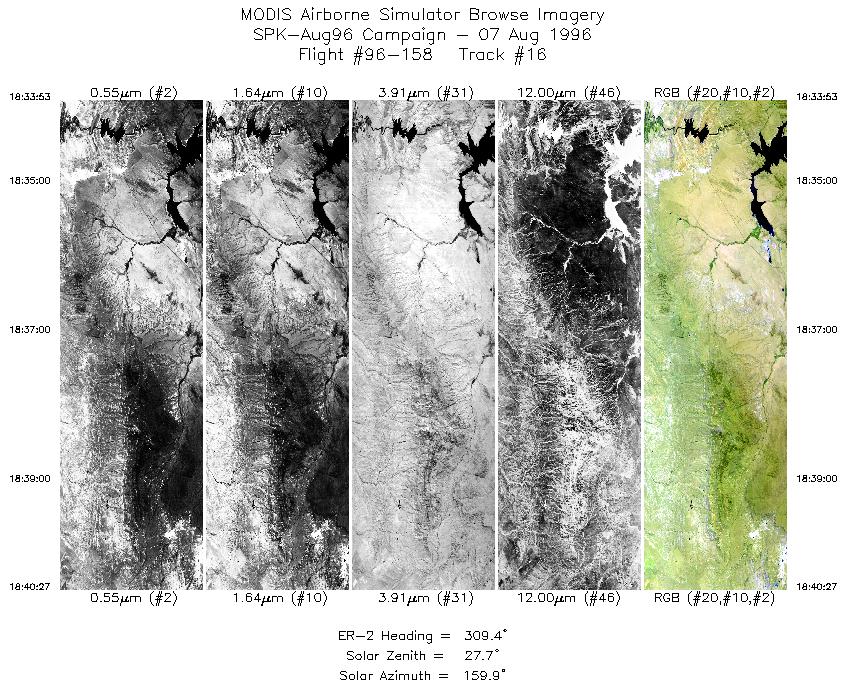
| 16 |
18:33-18:40 |
309 |
42.47-42.93 |
106.73-107.53 |
2450 |
~20000 |
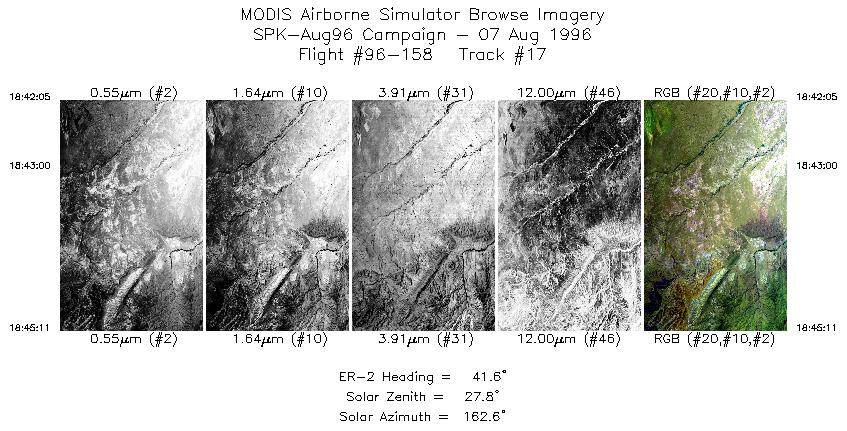
| 17 |
18:42-18:45 |
42 |
43.10-43.36 |
107.55-107.23 |
1157 |
~20000 |
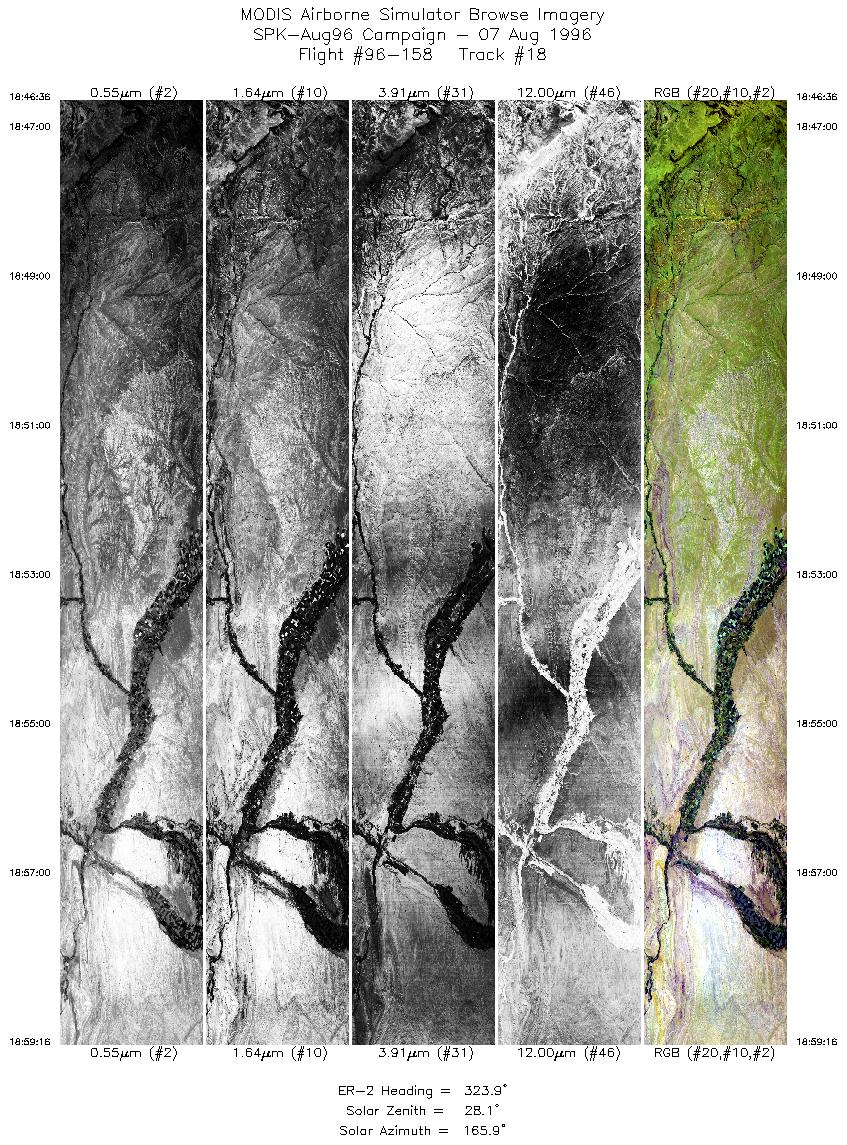
| 18 |
18:46-18:59 |
324 |
43.51-44.70 |
107.21-108.41 |
4725 |
~20000 |
| 19 |
19:04-19:15 |
143 |
44.90-43.86 |
108.46-107.38 |
4296 |
~20000 |
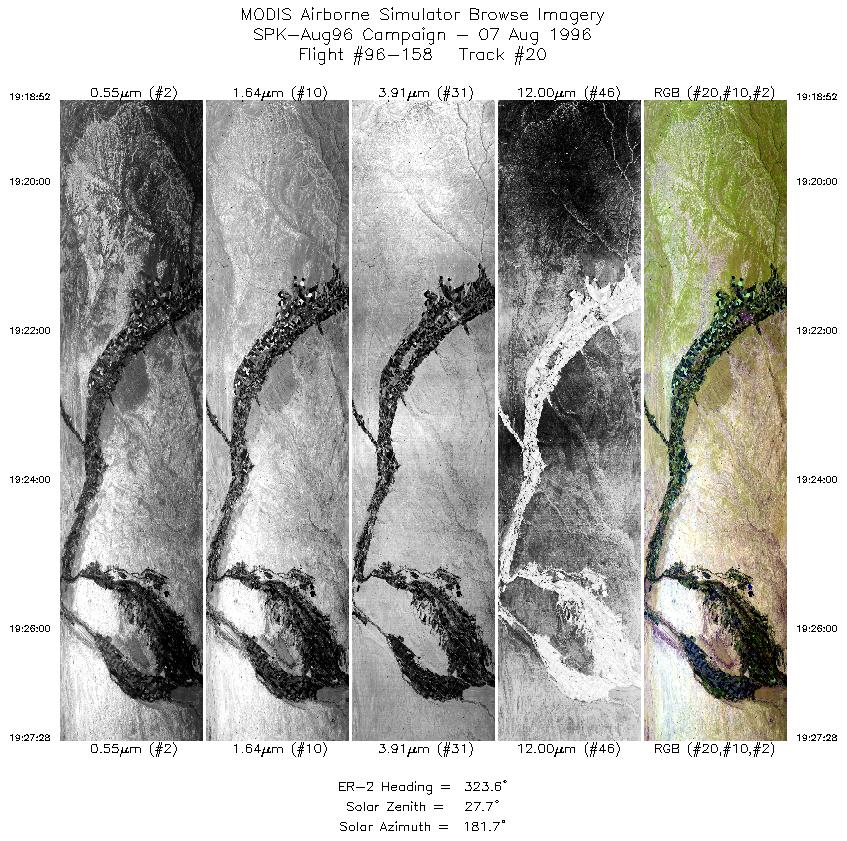
| 20 |
19:18-19:27 |
324 |
43.77-44.58 |
107.62-108.44 |
3208 |
~20000 |
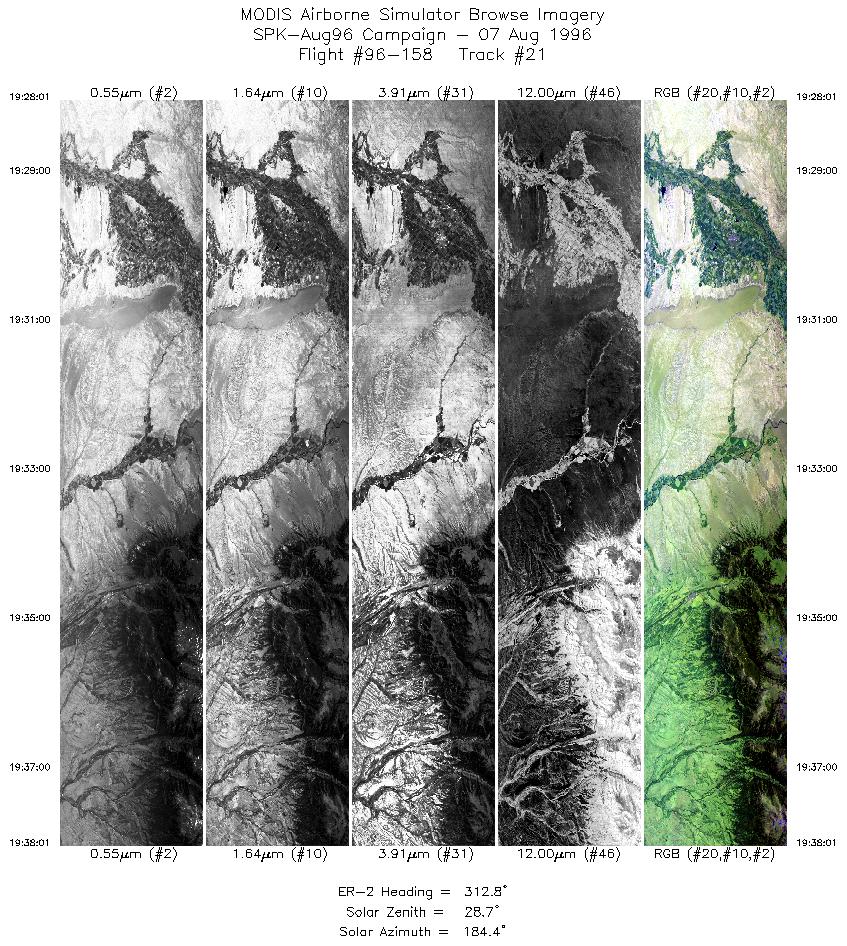
| 21 |
19:28-19:38 |
313 |
44.63-45.41 |
108.51-109.69 |
3730 |
~20000 |
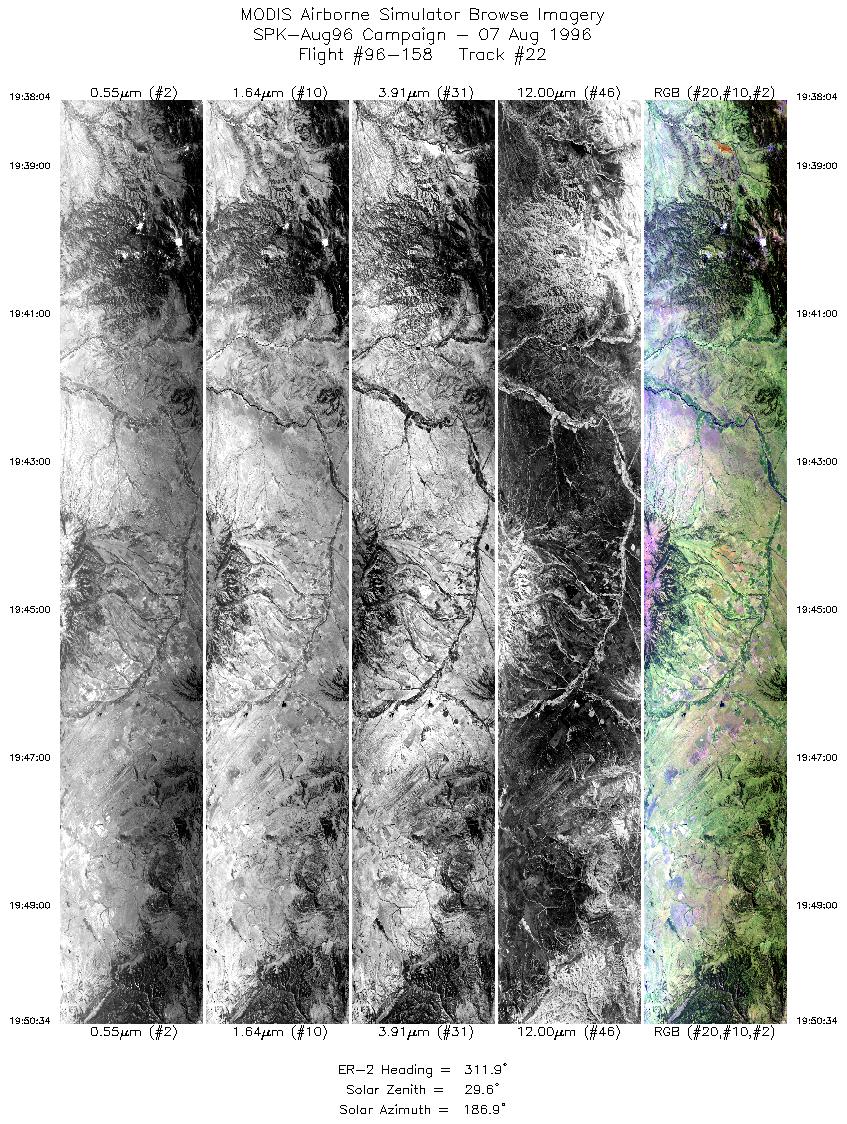
| 22 |
19:38-19:50 |
312 |
45.41-46.38 |
109.69-111.21 |
4624 |
~20000 |
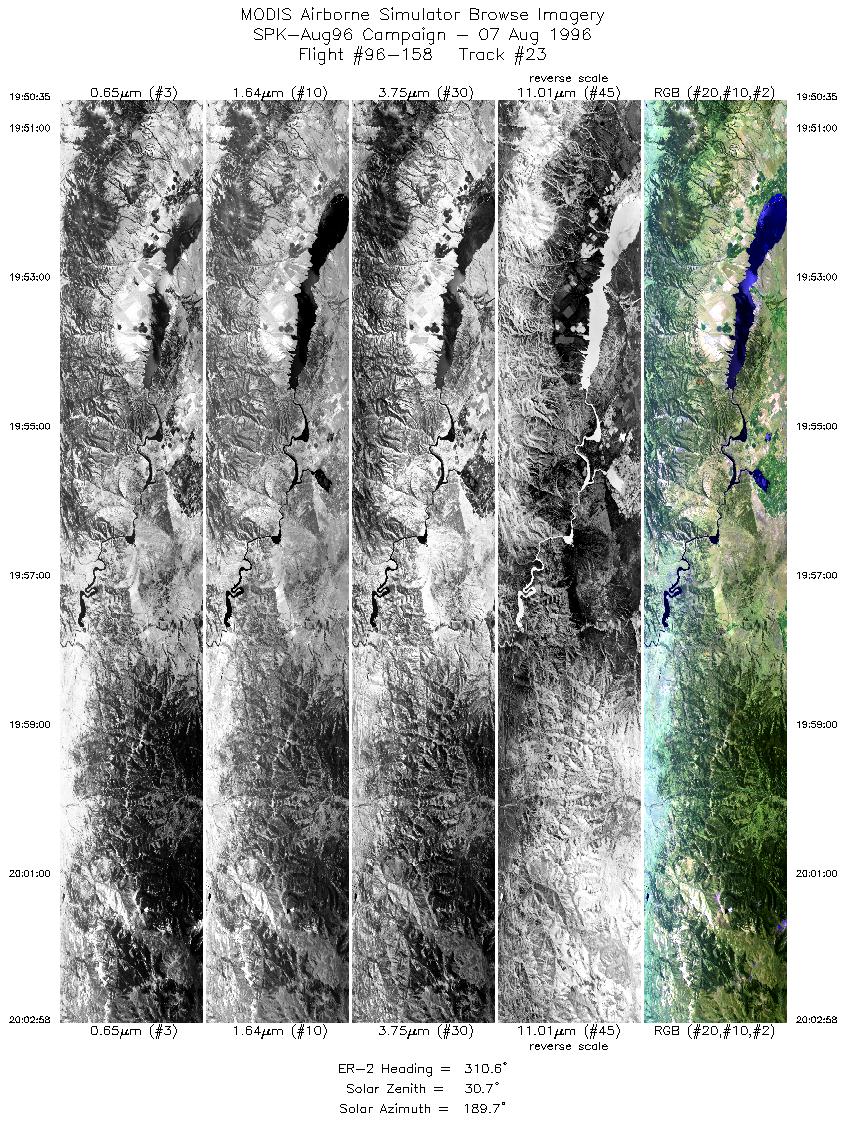
| 23 |
19:50-20:02 |
311 |
46.38-47.31 |
111.21-112.78 |
4619 |
~20000 |
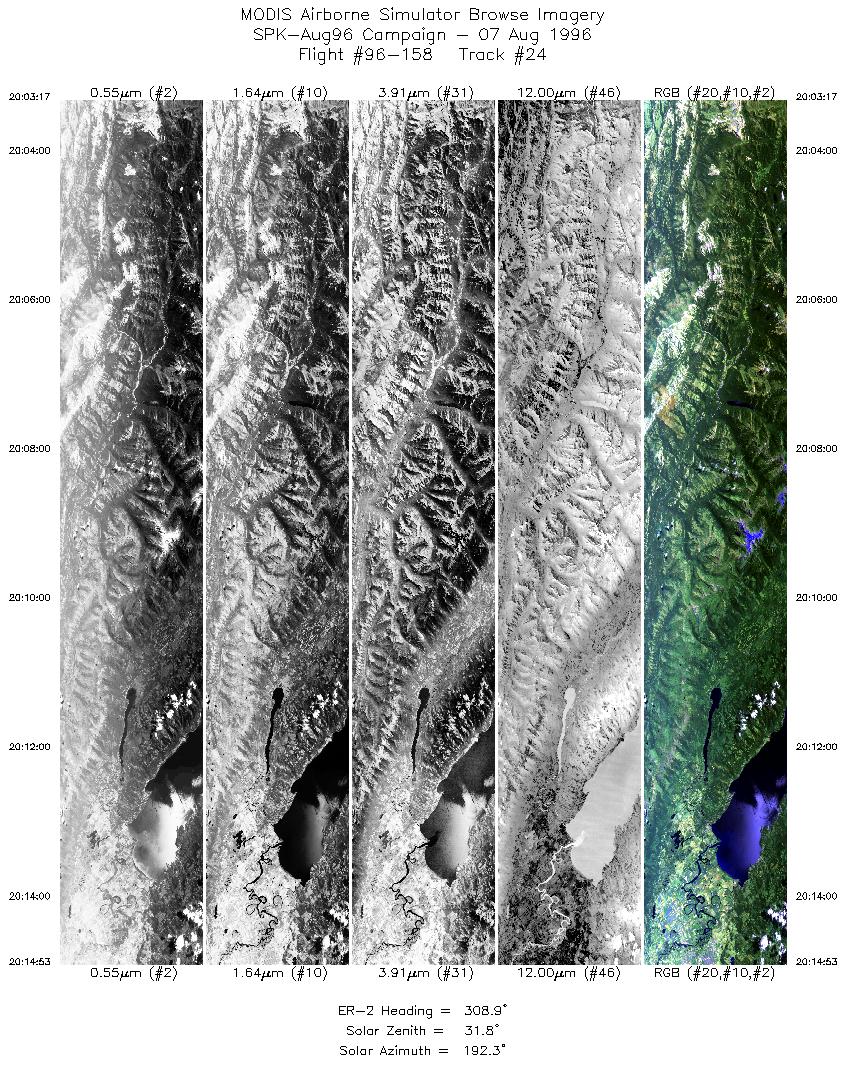
| 24 |
20:03-20:14 |
309 |
47.33-48.19 |
112.82-114.34 |
4327 |
~20000 |
|
Images 01 through 24 in sequence |
Data Evalutation
Some 400 Htz noise in channel 48.
Spectral Summary
Spectral Band Configuration
Spectral Response Files
Level-1B Data Distribution
NASA Goddard Space Flight Center DAAC
Related Web Sites
JPL AVIRIS Web Page
Airborne Sensors Facility Page
NASA ER-2 Aircraft Program
|
|