
|
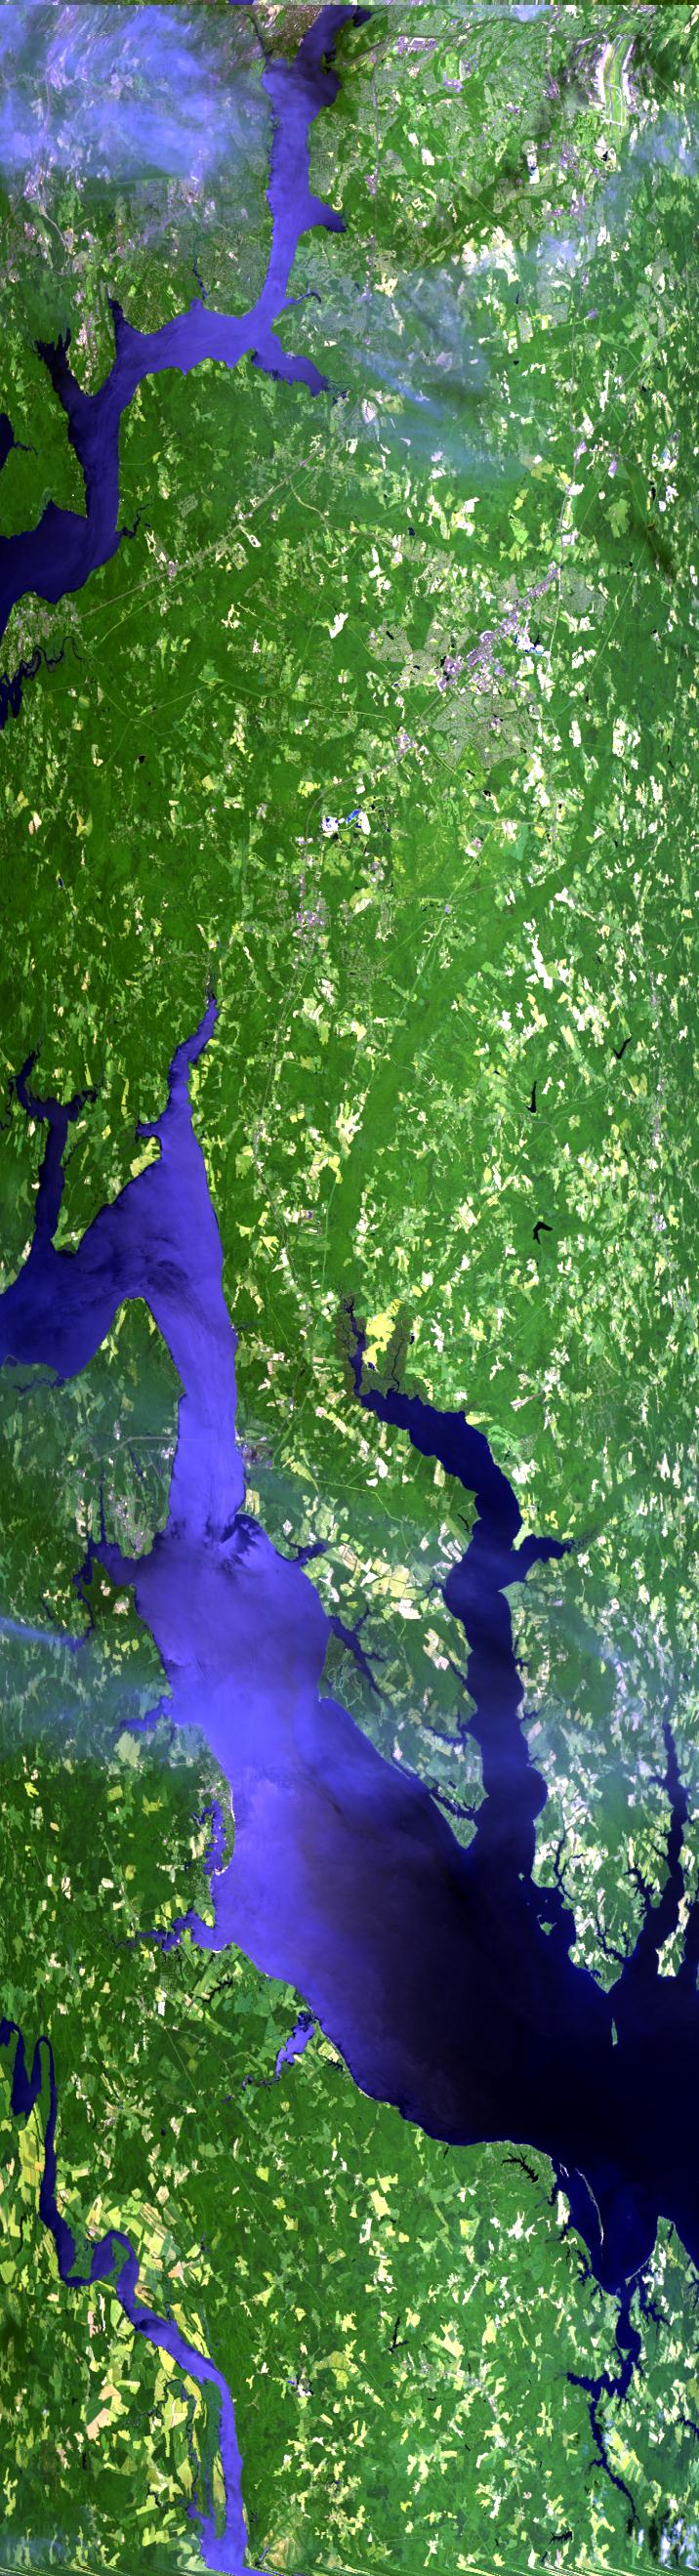
Sample Image

05 July 1996
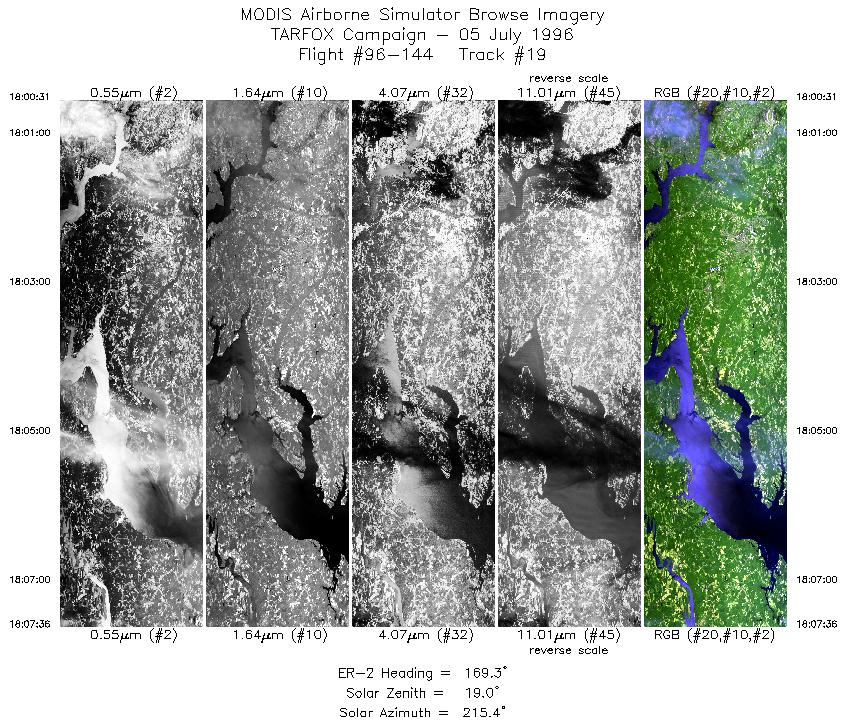
Track #19
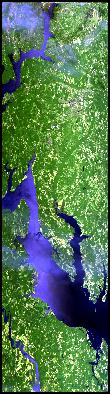
Begins over the upper Potomac River, south of Washington, D.C. Follows the Potomac past the Port Tobacco and Wicomico Rivers to Saint Clements Island. The Rappahannock River is to the left of the Potomac at the end of the flightline.
R: 2.15 microns
G: 1.65 microns
B: 0.55 microns
|
|
Mission Summary
Date: July 05, 1996
ER-2 Flight Number: 96-144
Deployment: pre-TARFOX
Flight Location: Wisconsin and Indiana
Principal Investigators: Dr. Baumgardner (Purdue) and Dr. John Aber (UNH)
Additional Sensors: 12" RC-10 (CIR), AVIRIS
Objective: Forest species composition and canopy chemistry; collect AVIRIS data at Lewis HSI sites; and provide field validation of MODIS algorithms prediction NPP, LAI, and land cover (Aber).
Level-1B Processing Information
Level-1B Data processed by: Ames Research Center
Level-1B Data Version: #09
Level-1B Configuration: (sample file)
Calibration Type: Final
Calibration Version: 1.0
Temperature Adjustment: No
Status: Completed with final calibration
|
|
Flight Track Map

|
Level-1B Browse Imagery
Straight Line Flight Tracks: 21
Scanlines Processed: 77481
Solar Azimuth and Zenith Angles
|
Browse Images
|
Click on the Flight Track number to load images.
Lat/Lon ranges are for the BEG-END scanline nadir pixels.
|
Flight
Track |
Time_Span
(GMT) |
Heading
(Deg) |
Lat_Range
(Deg_N) |
Lon_Range
(Deg_W) |
Length
(Scanlines) |
Altitude
(Meters) |
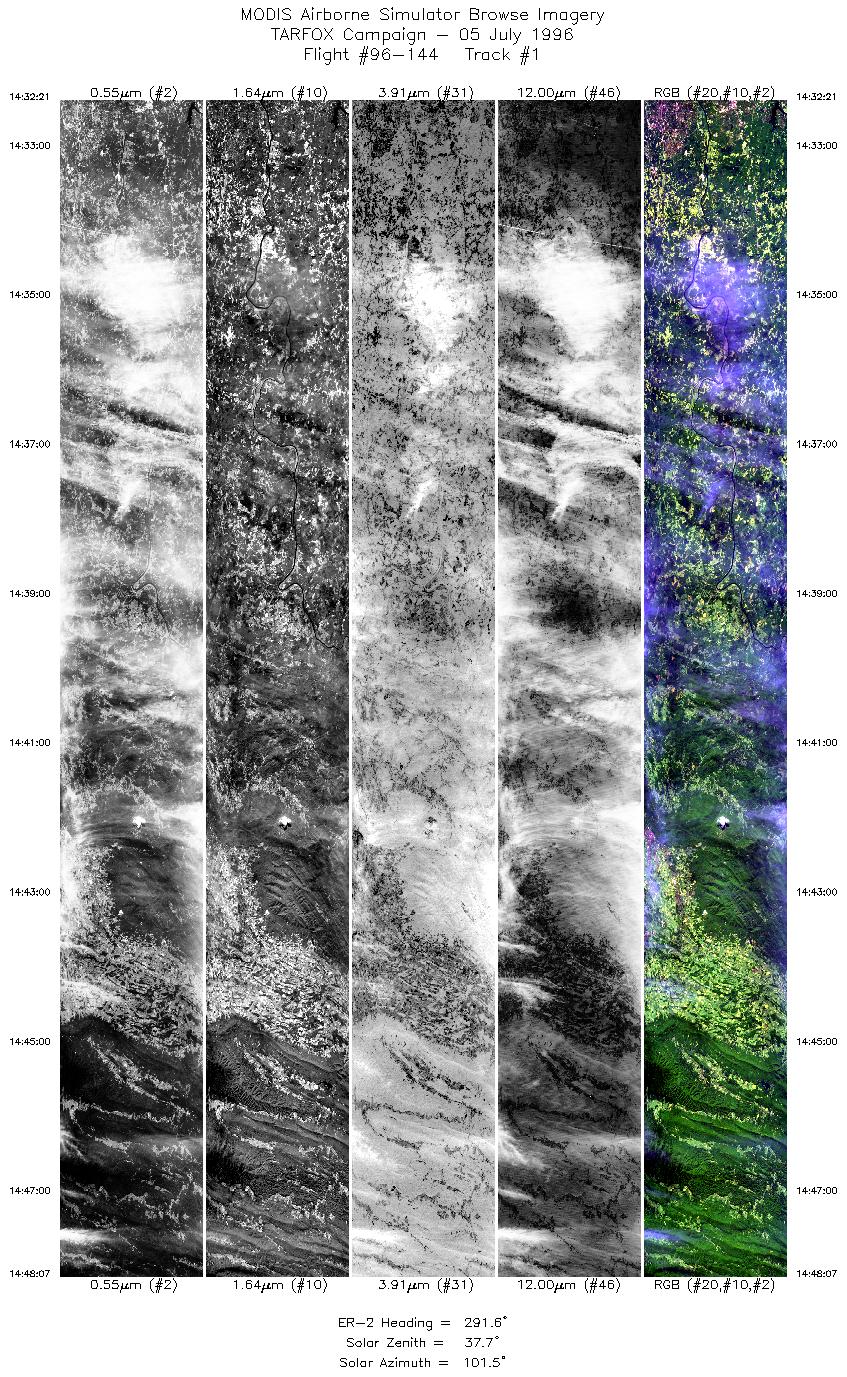
| 1 |
14:32-14:48 |
292 |
37.53-38.16 |
77.58-79.77 |
5886 |
~20000 |
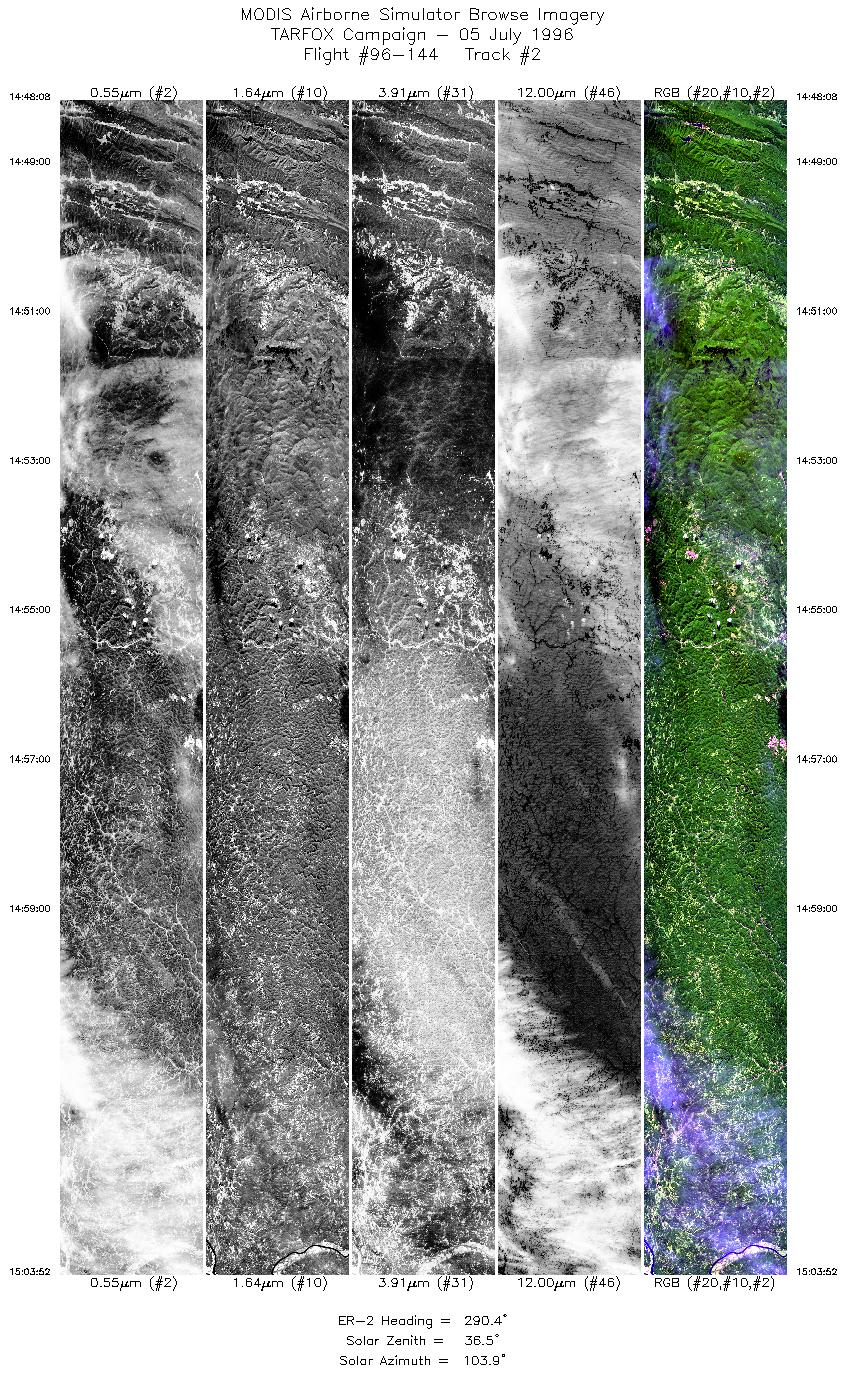
| 2 |
14:48-15:03 |
290 |
38.16-38.75 |
79.76-81.98 |
5875 |
~20000 |
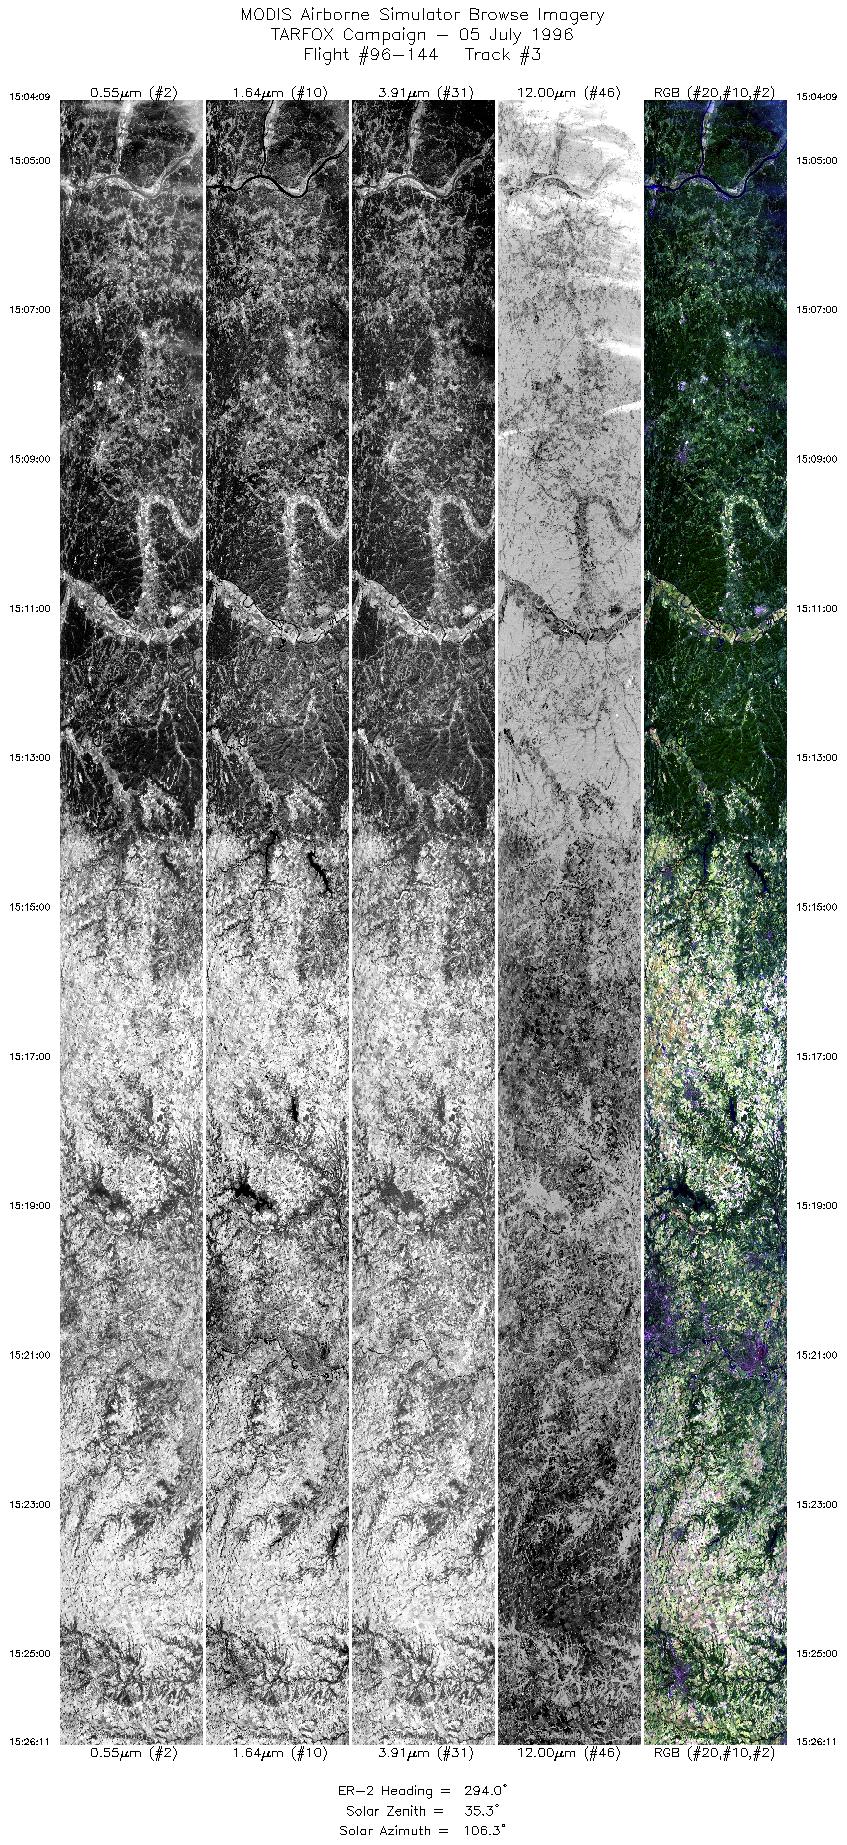
| 3 |
15:04-15:26 |
294 |
38.76-39.81 |
82.01-85.06 |
8225 |
~20000 |
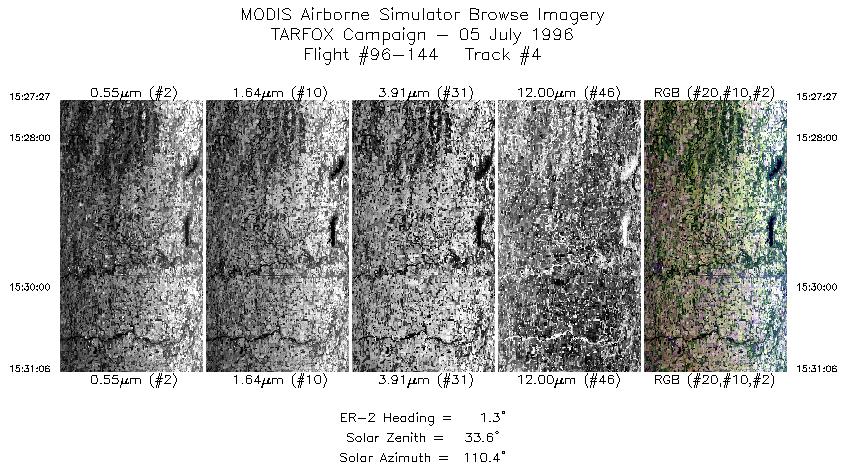
| 4 |
15:27-15:31 |
1 |
39.92-40.34 |
85.15-85.15 |
1364 |
~20000 |
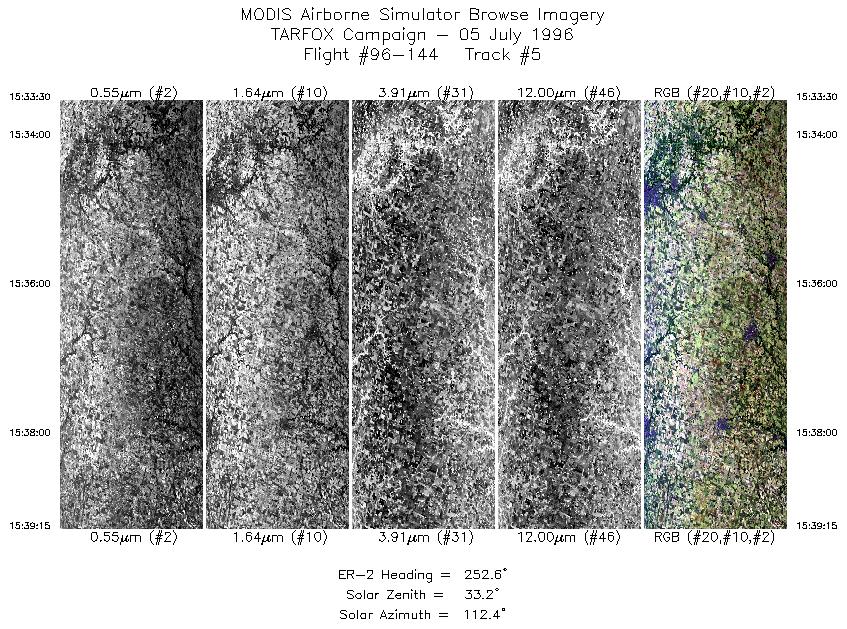
| 5 |
15:33-15:39 |
253 |
40.44-40.25 |
85.41-86.24 |
2146 |
~20000 |
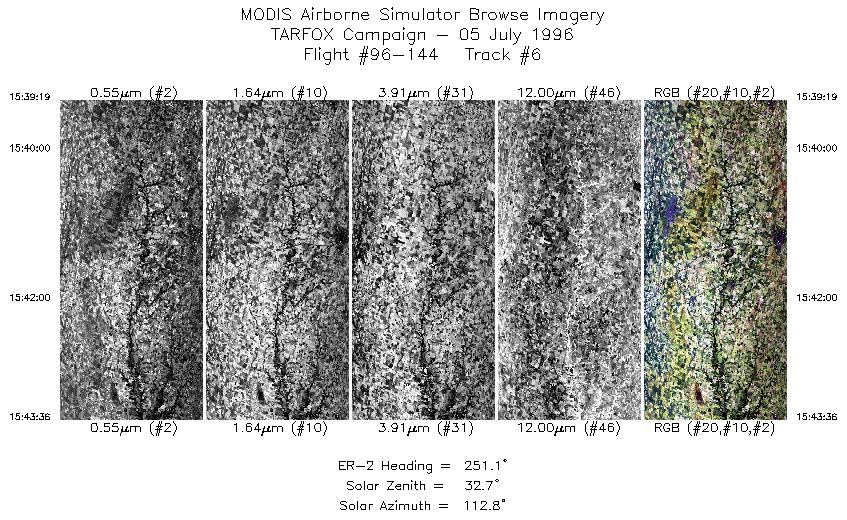
| 6 |
15:39-15:43 |
251 |
40.24-40.09 |
86.25-86.88 |
1600 |
~20000 |
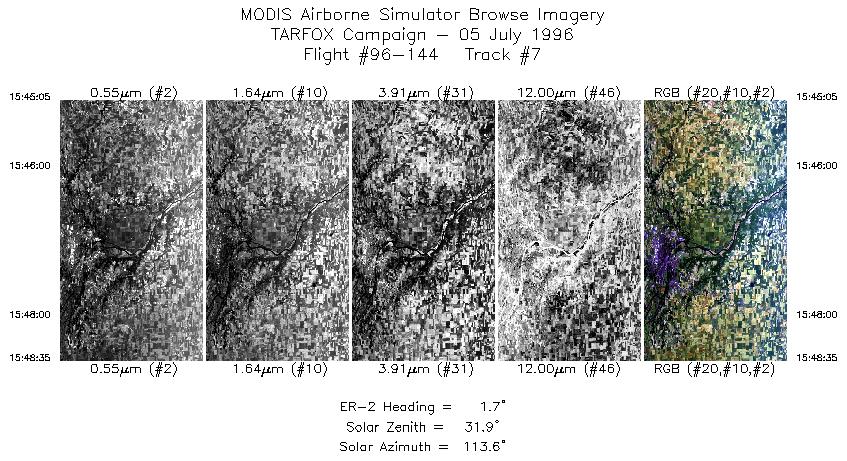
| 7 |
15:45-15:48 |
2 |
40.18-40.57 |
87.04-87.04 |
1307 |
~20000 |
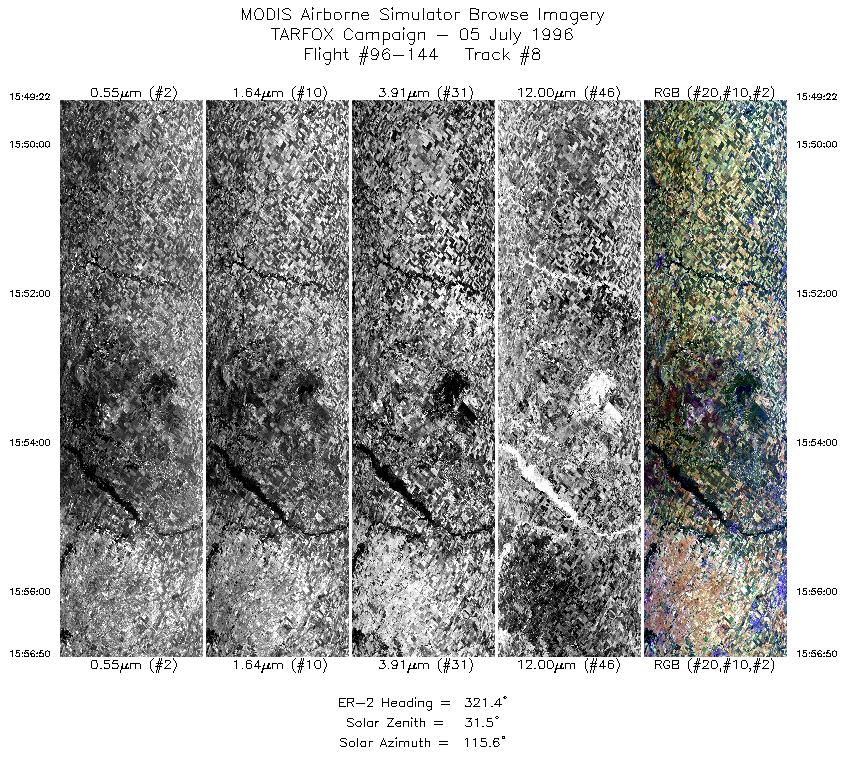
| 8 |
15:49-15:56 |
321 |
40.66-41.34 |
87.07-87.80 |
2789 |
~20000 |
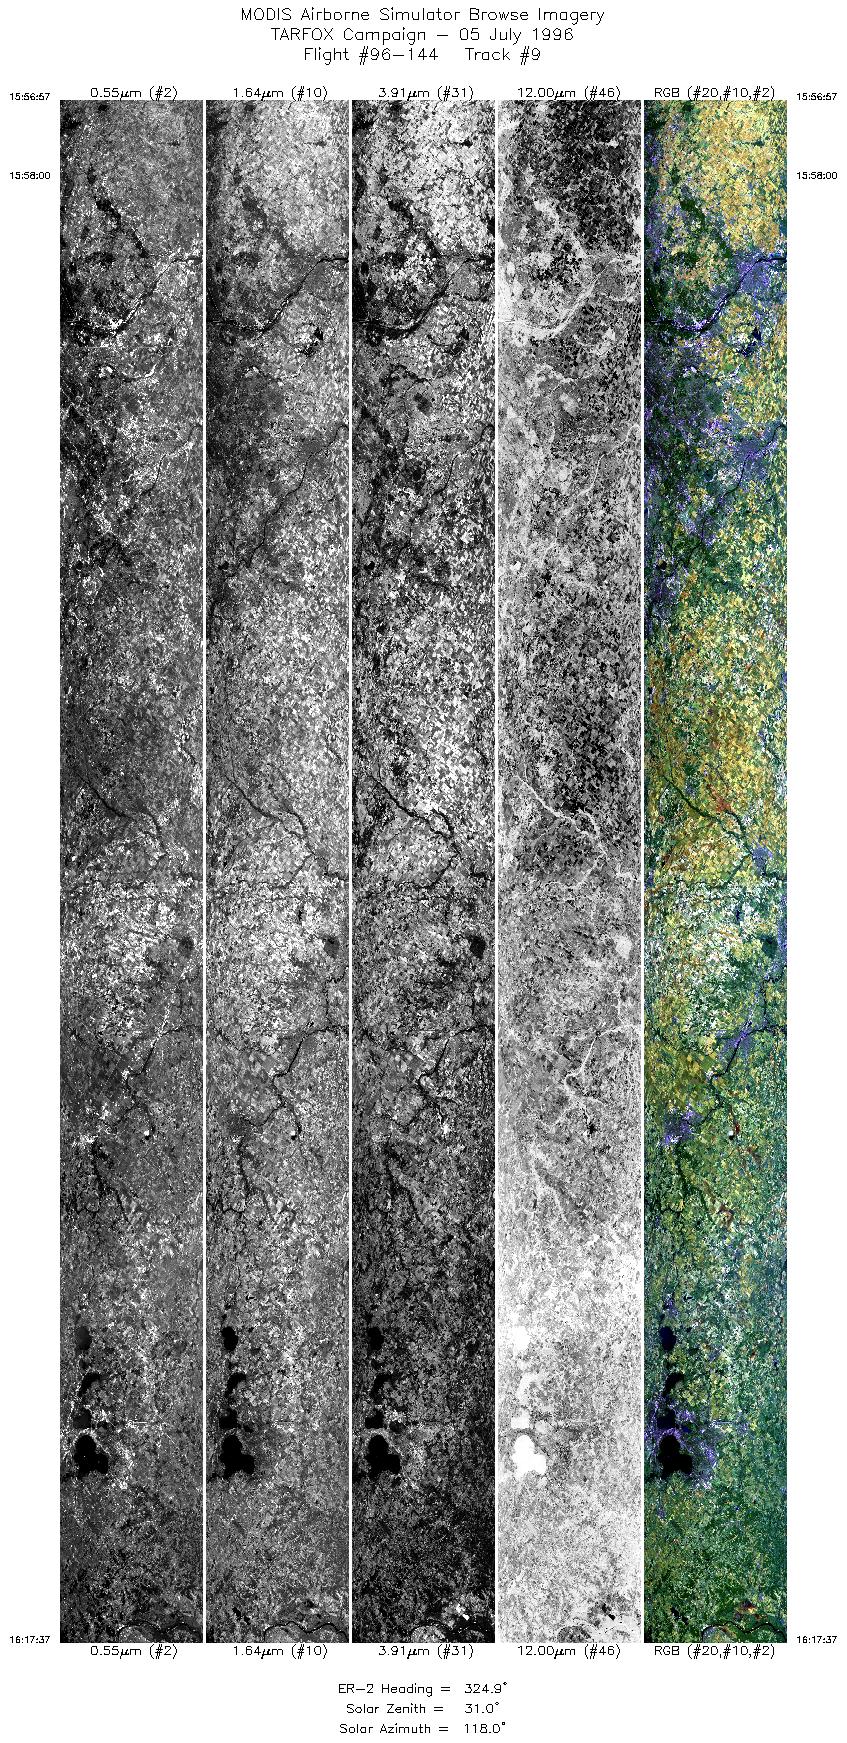
| 9 |
15:56-16:17 |
325 |
41.35-43.28 |
87.80-89.75 |
7715 |
~20000 |
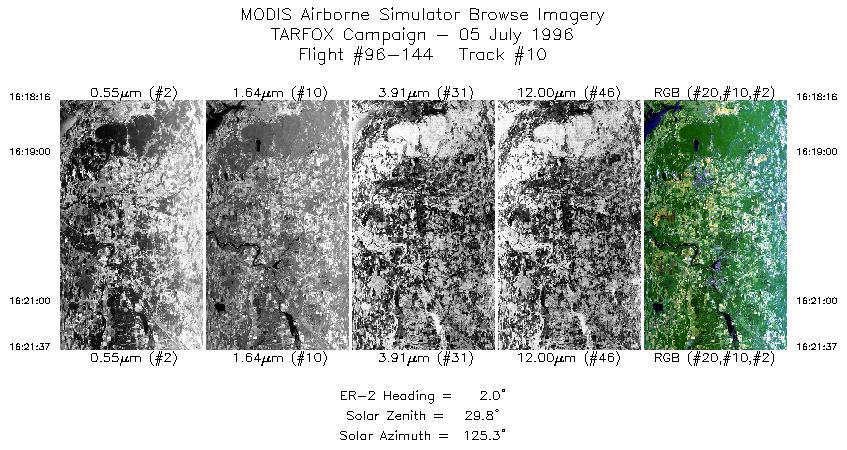
| 10 |
16:18-16:21 |
2 |
43.35-43.73 |
89.79-89.79 |
1251 |
~20000 |
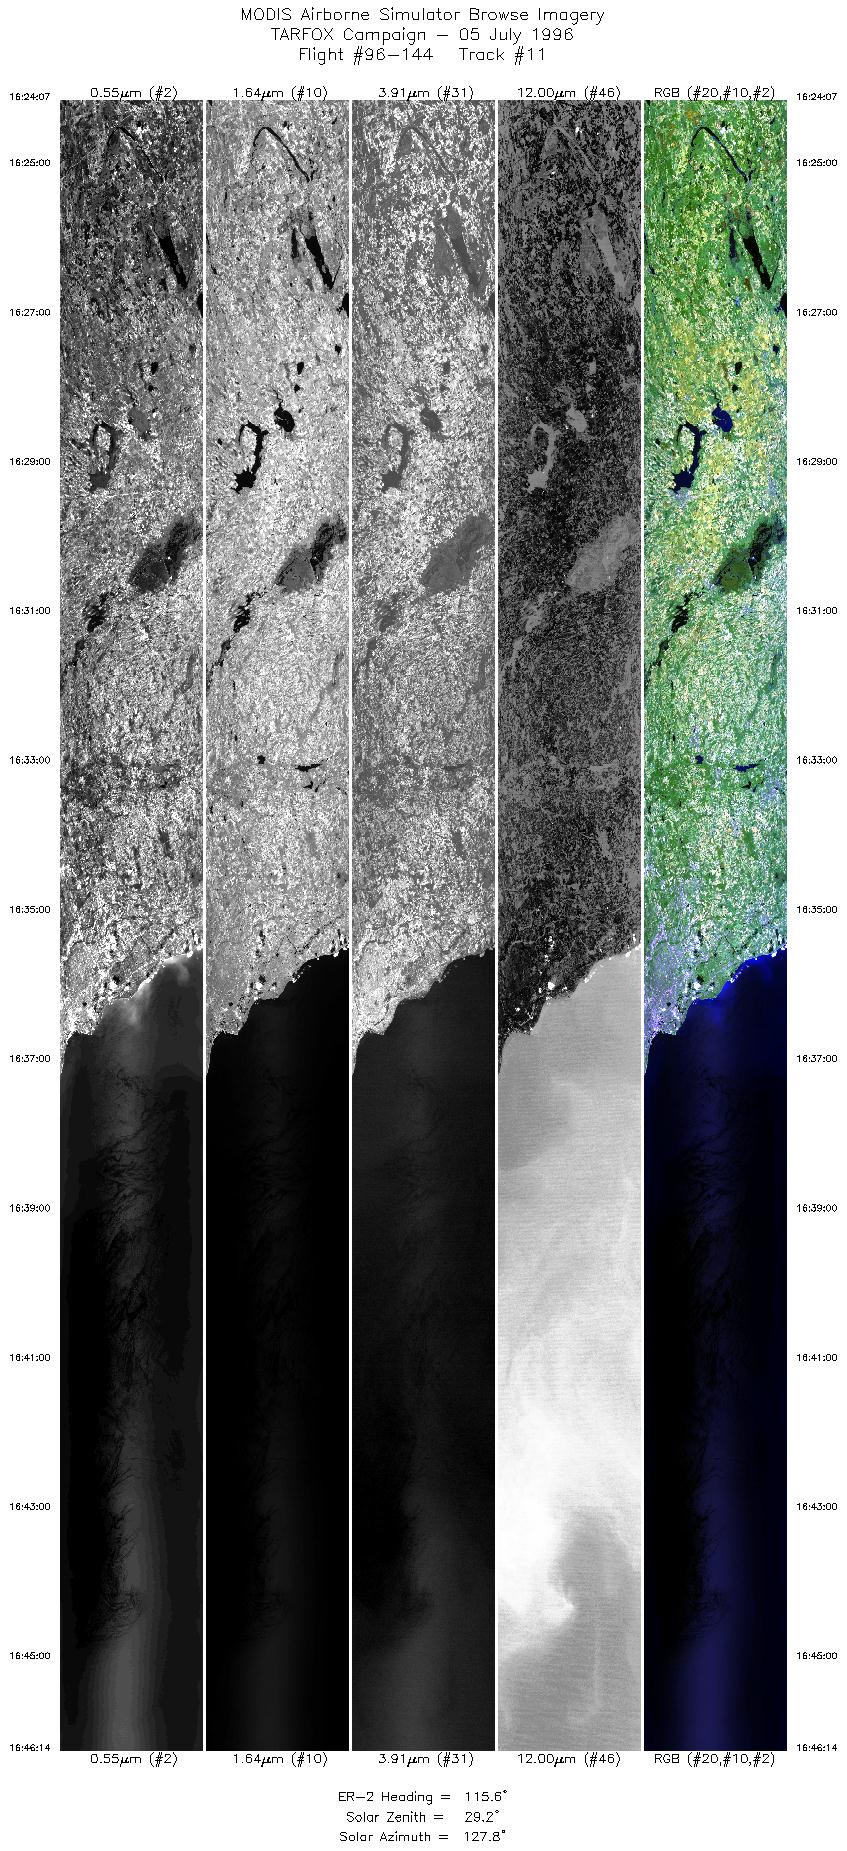
| 11 |
16:24-16:46 |
116 |
43.80-42.65 |
89.51-86.52 |
8256 |
~20000 |
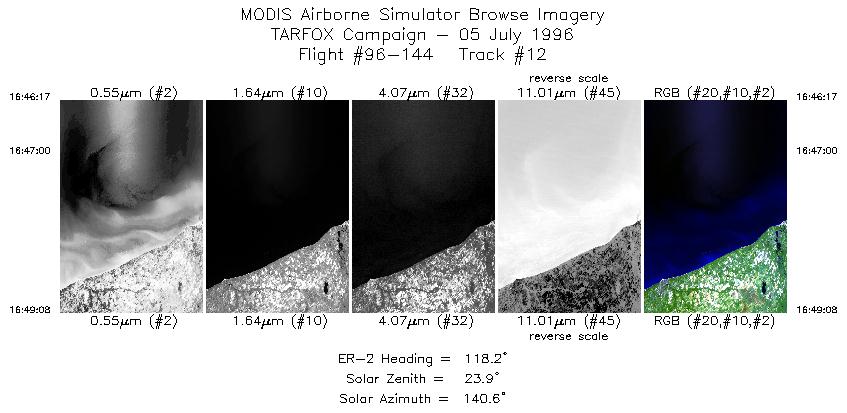
| 12 |
16:46-16:49 |
118 |
42.64-42.48 |
86.53-86.15 |
1065 |
~20000 |
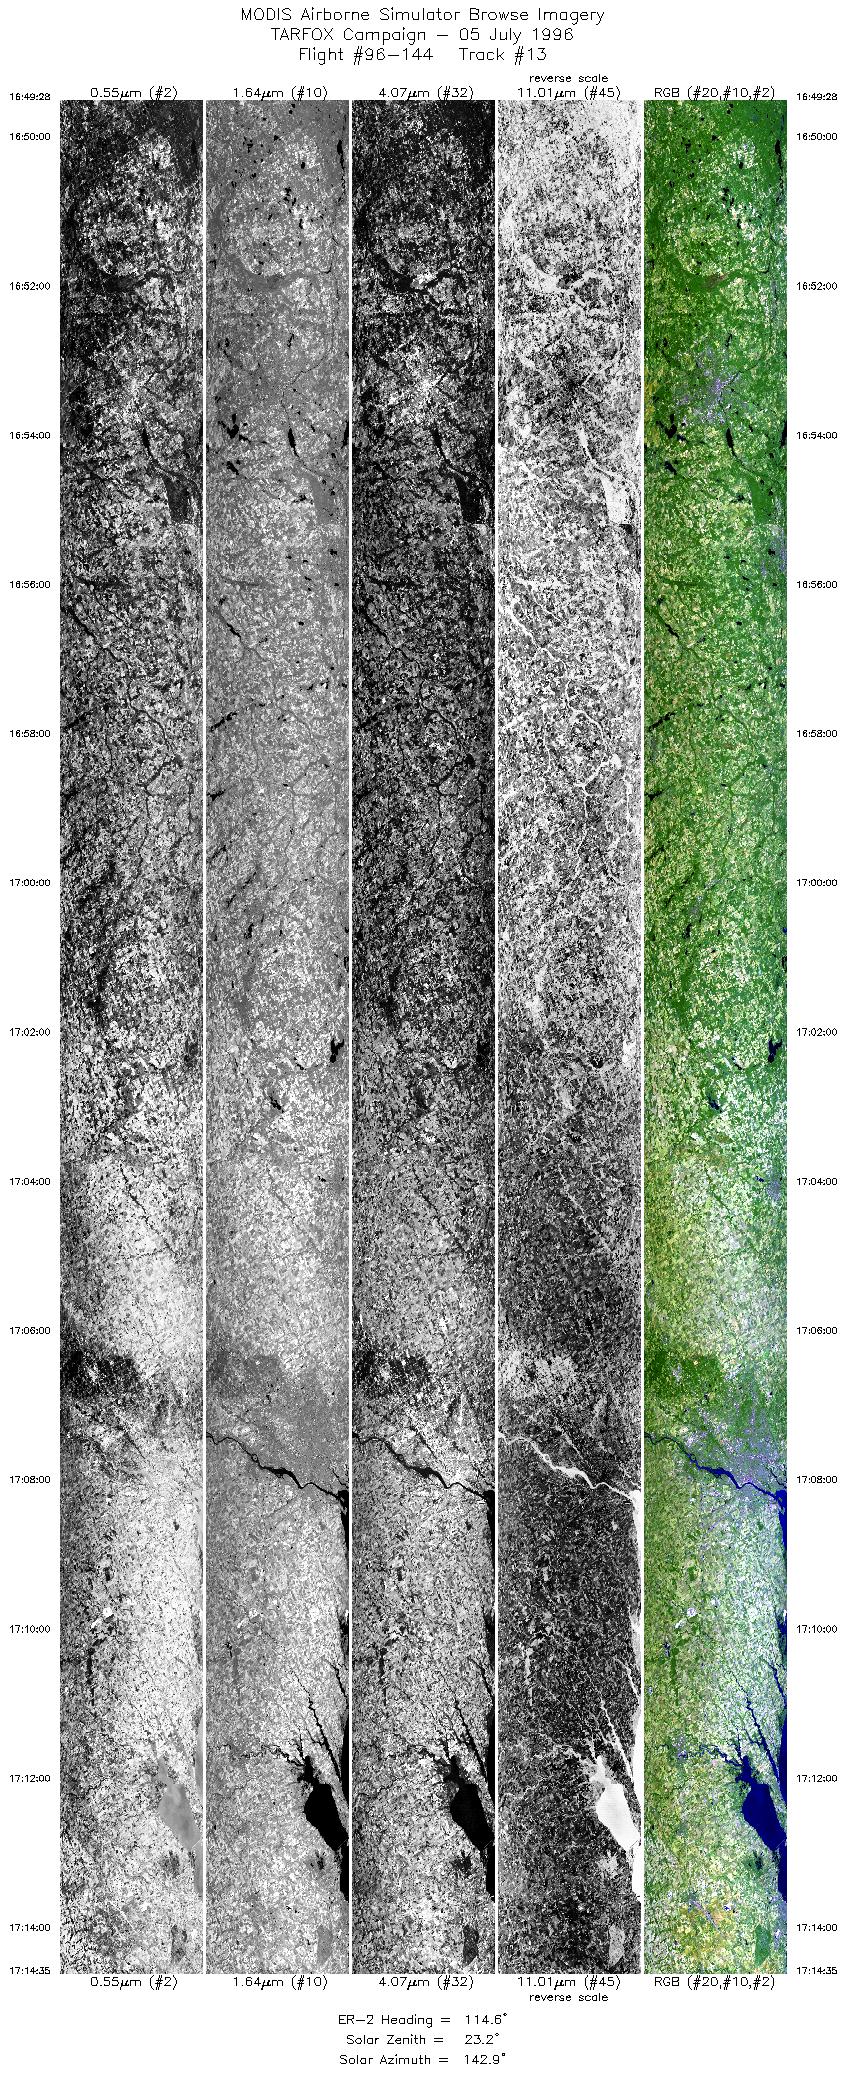
| 13 |
16:49-17:14 |
115 |
42.47-41.28 |
86.10-82.66 |
9374 |
~20000 |
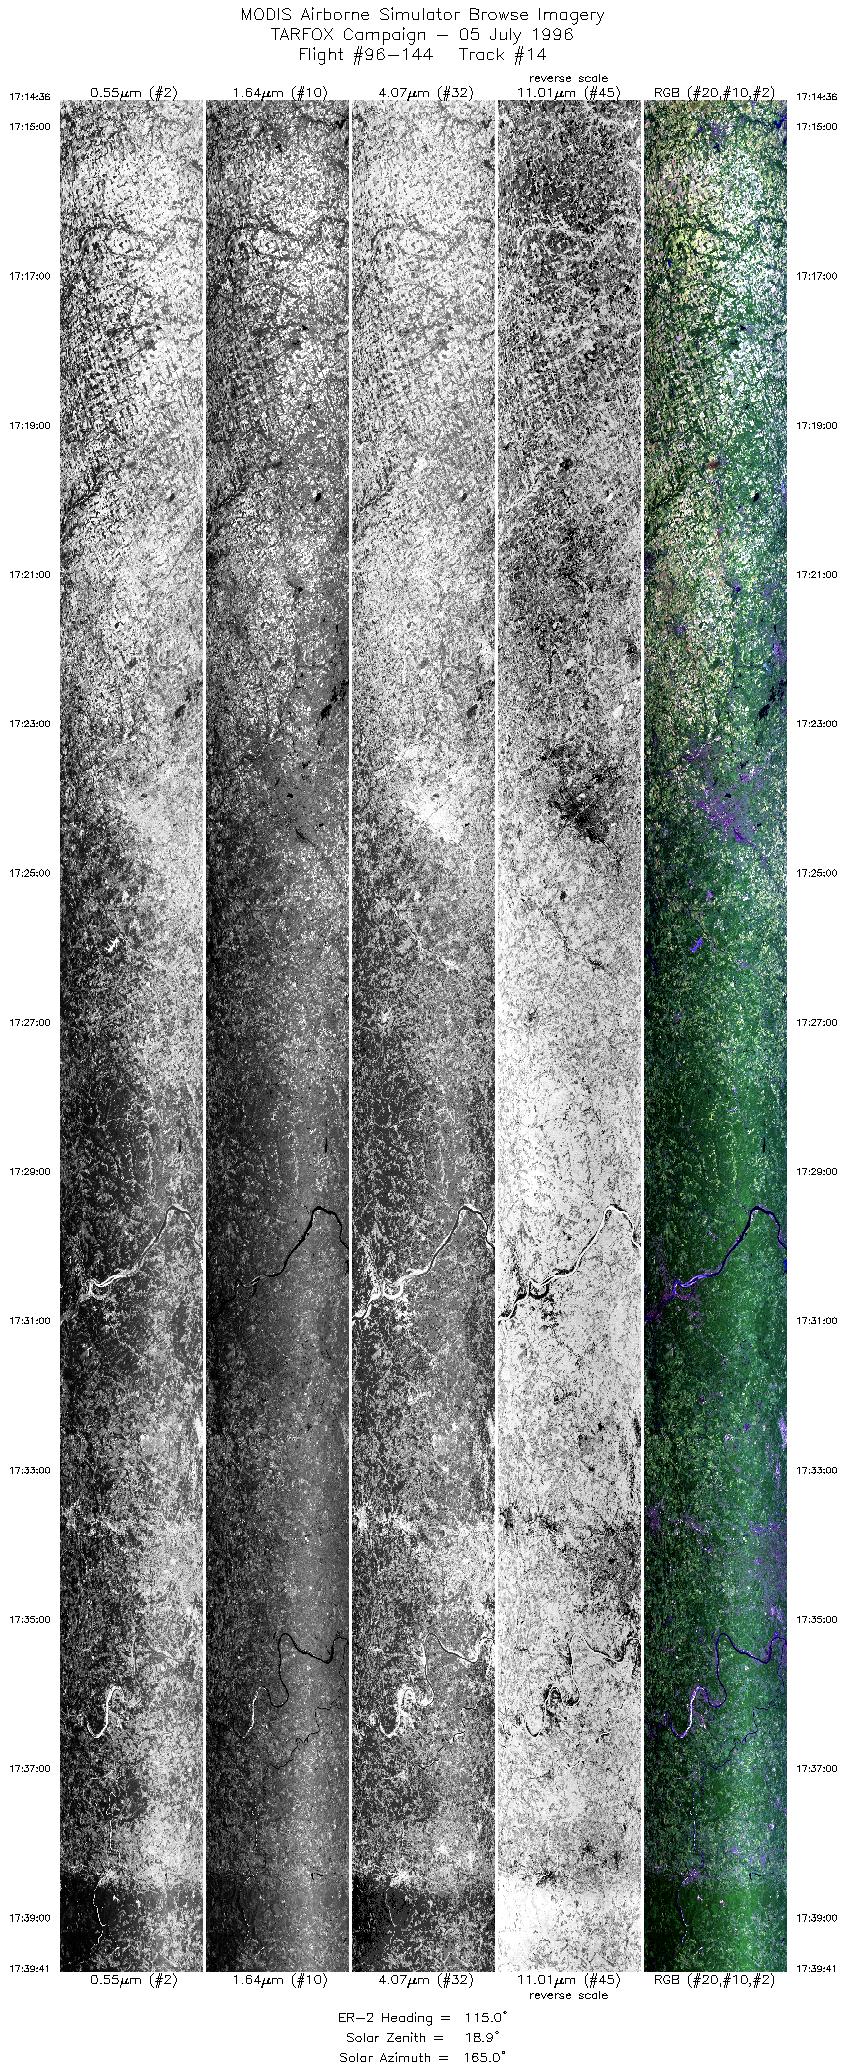
| 14 |
17:14-17:39 |
115 |
41.27-39.99 |
82.65-79.38 |
9363 |
~20000 |
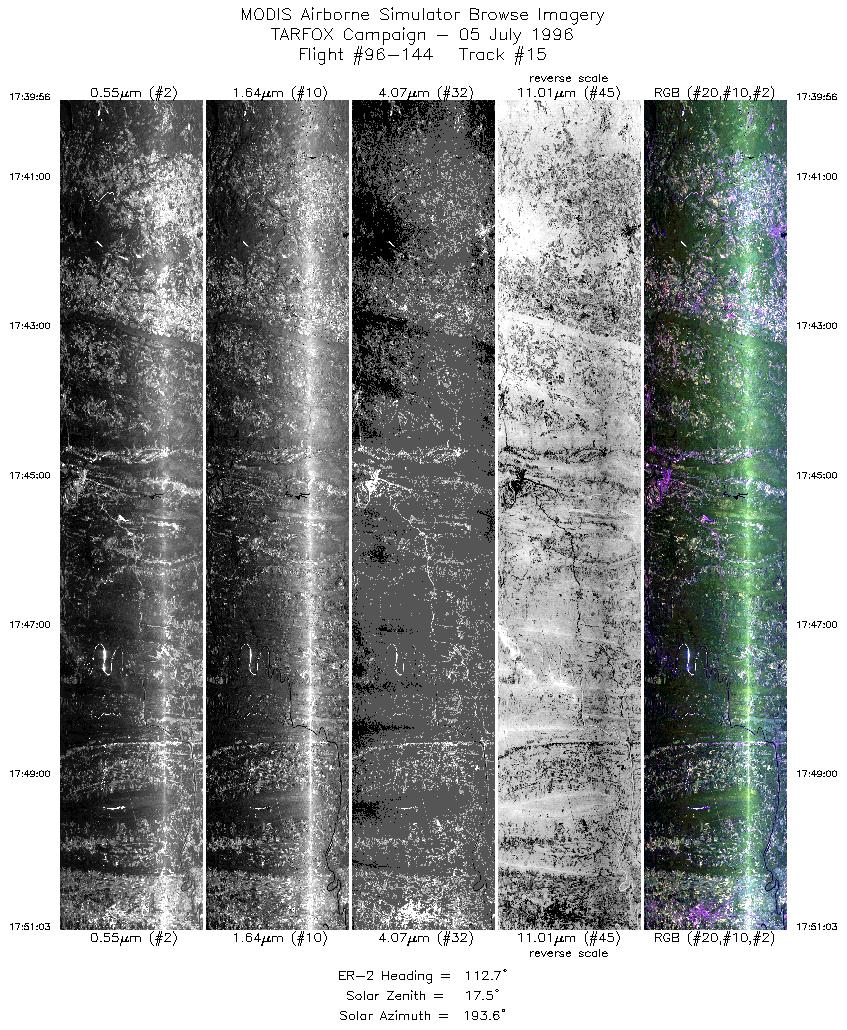
| 15 |
17:39-17:51 |
113 |
39.98-39.47 |
79.37-77.93 |
4151 |
~20000 |
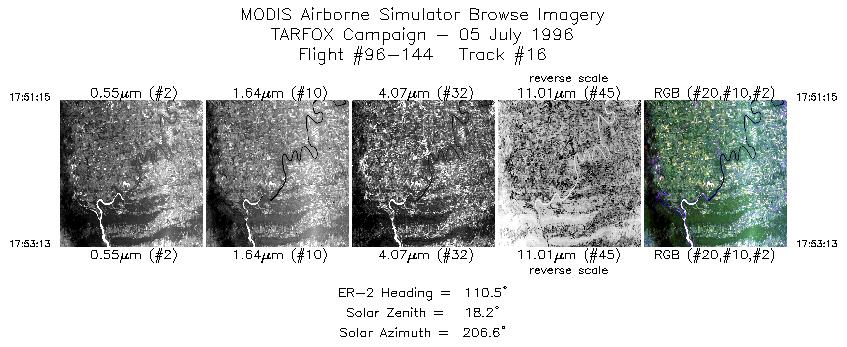
| 16 |
17:51-17:53 |
110 |
39.46-39.38 |
77.90-77.64 |
735 |
~20000 |
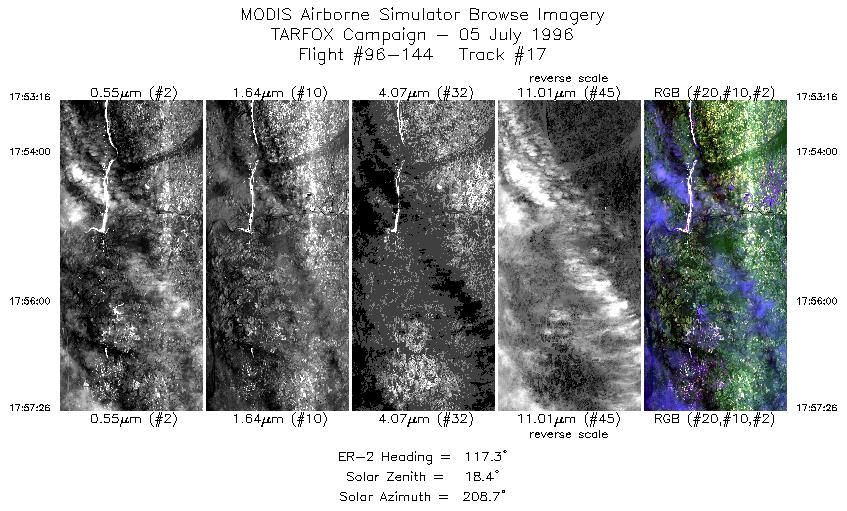
| 17 |
17:53-17:57 |
117 |
39.38-39.15 |
77.63-77.12 |
1556 |
~20000 |
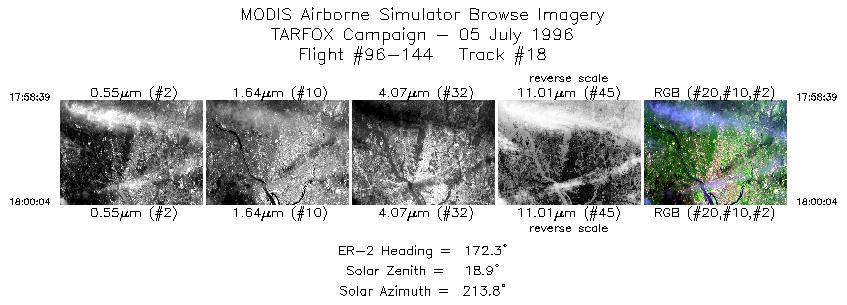
| 18 |
17:58-18:00 |
172 |
39.03-38.87 |
77.04-77.02 |
529 |
~20000 |
| 19 |
18:00-18:07 |
169 |
38.83-38.03 |
77.02-76.85 |
2638 |
~20000 |
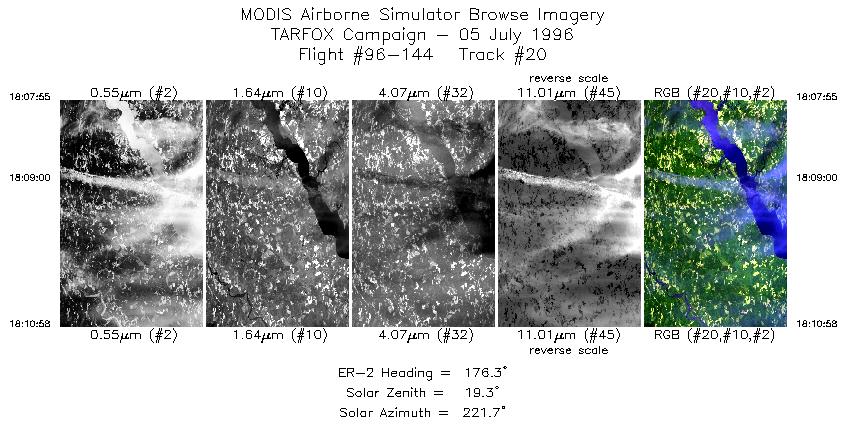
| 20 |
18:07-18:10 |
176 |
37.99-37.64 |
76.84-76.83 |
1139 |
~20000 |
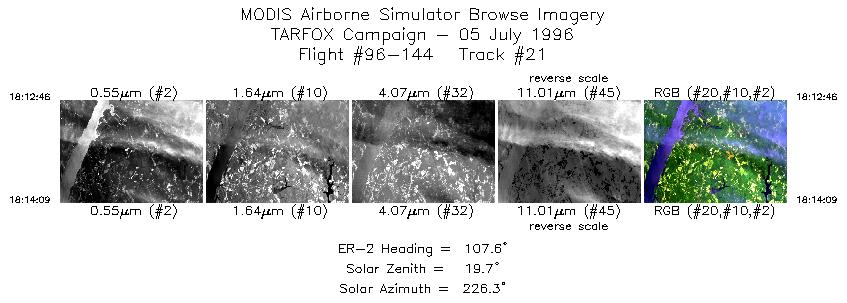
| 21 |
18:12-18:14 |
108 |
37.49-37.45 |
76.69-76.51 |
517 |
~20000 |
|
Images 01 through 21 in sequence |
Data Evalutation
Data quality is nominal, however, track 10, channel 5 shows static.
Spectral Summary
Spectral Band Configuration
Spectral Response Files
Level-1B Data Distribution
NASA Goddard Space Flight Center DAAC
Related Web Sites
JPL AVIRIS Web Page
Airborne Sensors Facility Page
NASA ER-2 Aircraft Program
|
|