
|
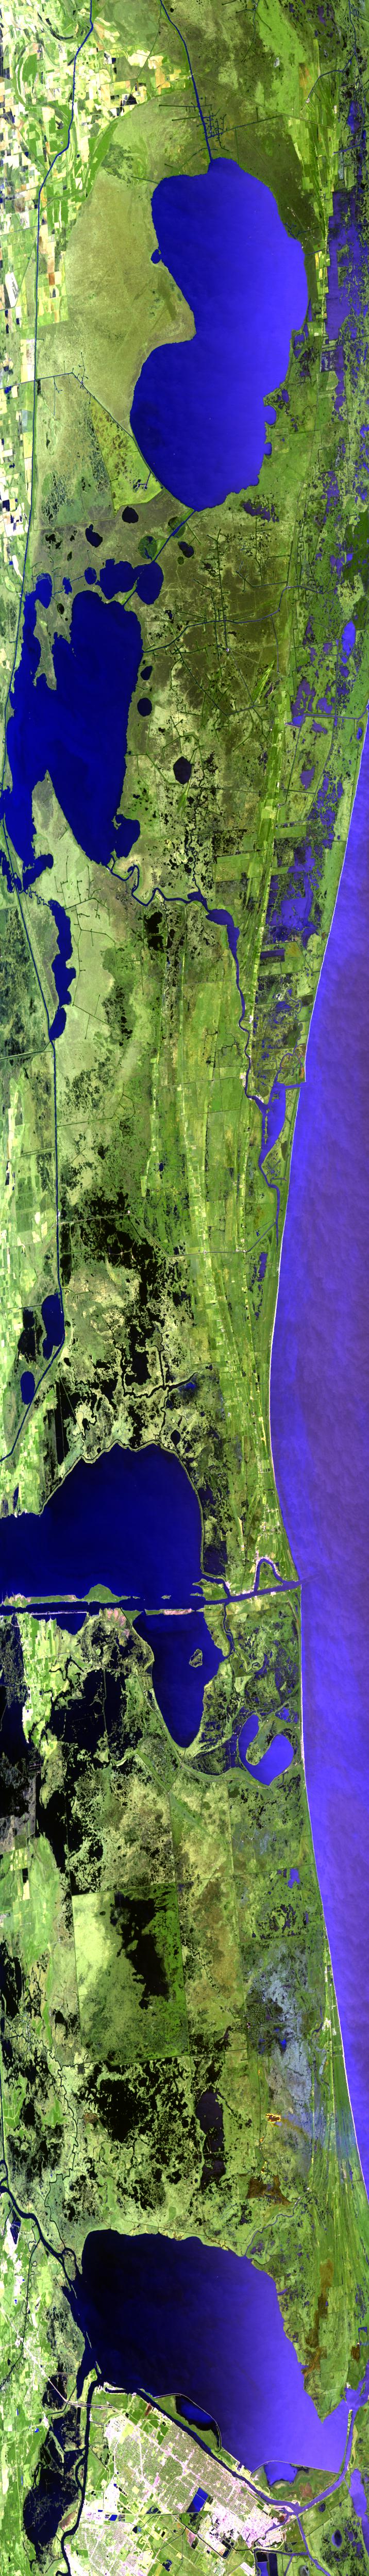
Sample Image

23 Sept 1995
Track #24


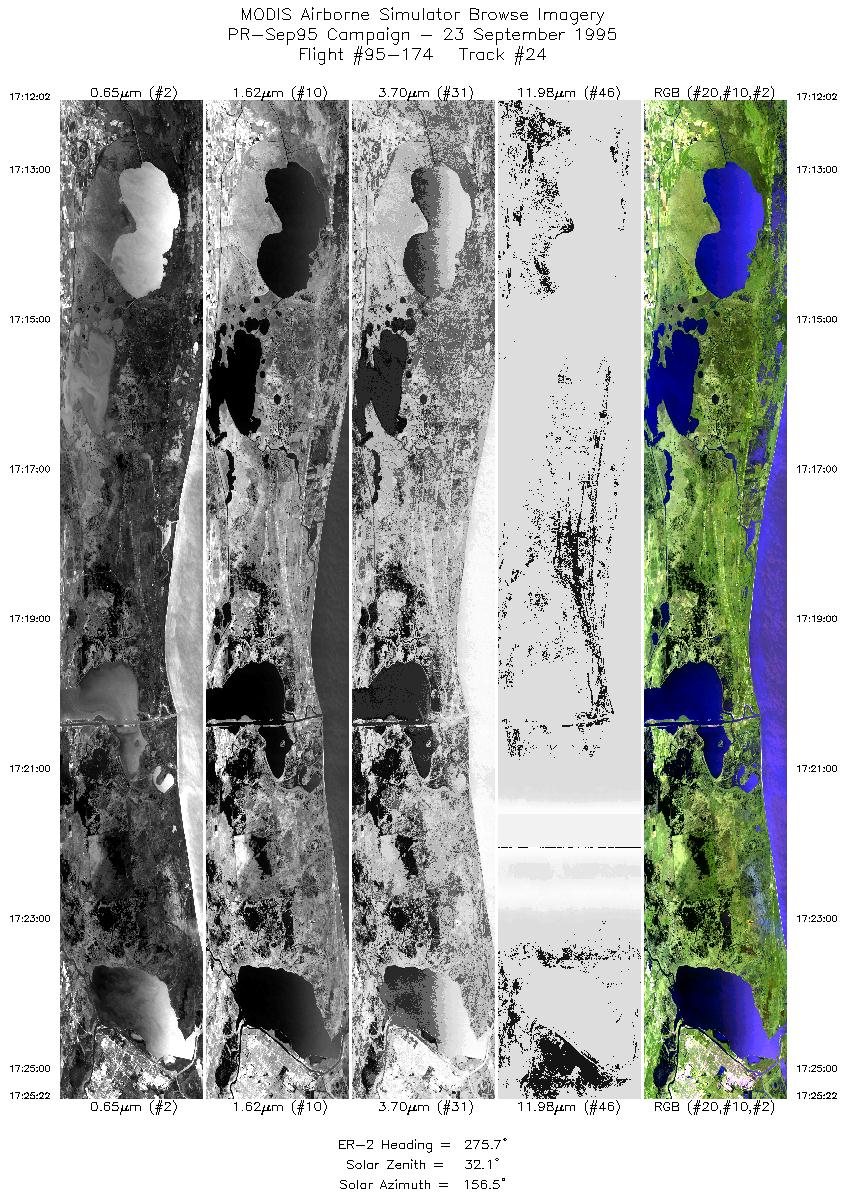
Port Arthur coastline of Louisiana, beginning over White Lake and ending west of Sabine Lake, over Port Neches, Texas.
R: 2.14 microns
G: 1.62 microns
B: 0.55 microns
|
|
Mission Summary
Date: September 23, 1995
ER-2 Flight Number: 95-174
Deployment: Puerto Rico-Sep95
Flight Location: Ferry: Puerto Rico to Austin, Texas
Principal Investigator: Dr. Armond Joyce (SSC)
Additional Sensors: Dual 24" HR732 (NC and CIR)
Objective: Data used to study land/sea interactions in Puerto Rico and the Southeastern United States.
Level-1B Processing Information
Level-1B Data processed by: Ames Research Center
Level-1B Data Version: #09
Level-1B Configuration: (sample file)
Calibration Type: Final
Calibration Version: 1.0
Temperature Adjustment: 24C
Status: Completed with final calibration
|
|
Flight Track Map

|
Level-1B Browse Imagery
Straight Line Flight Tracks: 26
Scanlines Processed: 96852
Solar Azimuth and Zenith Angles
|
Browse Images
|
Click on the Flight Track number to load images.
Lat/Lon ranges are for the BEG-END scanline nadir pixels.
|
Flight
Track |
Time_Span
(GMT) |
Heading
(Deg) |
Lat_Range
(Deg_N) |
Lon_Range
(Deg_W) |
Length
(Scanlines) |
Altitude
(Meters) |
| 1 |
13:20-13:33 |
301 |
20.32-21.10 |
69.77-71.17 |
5000 |
~20000 |
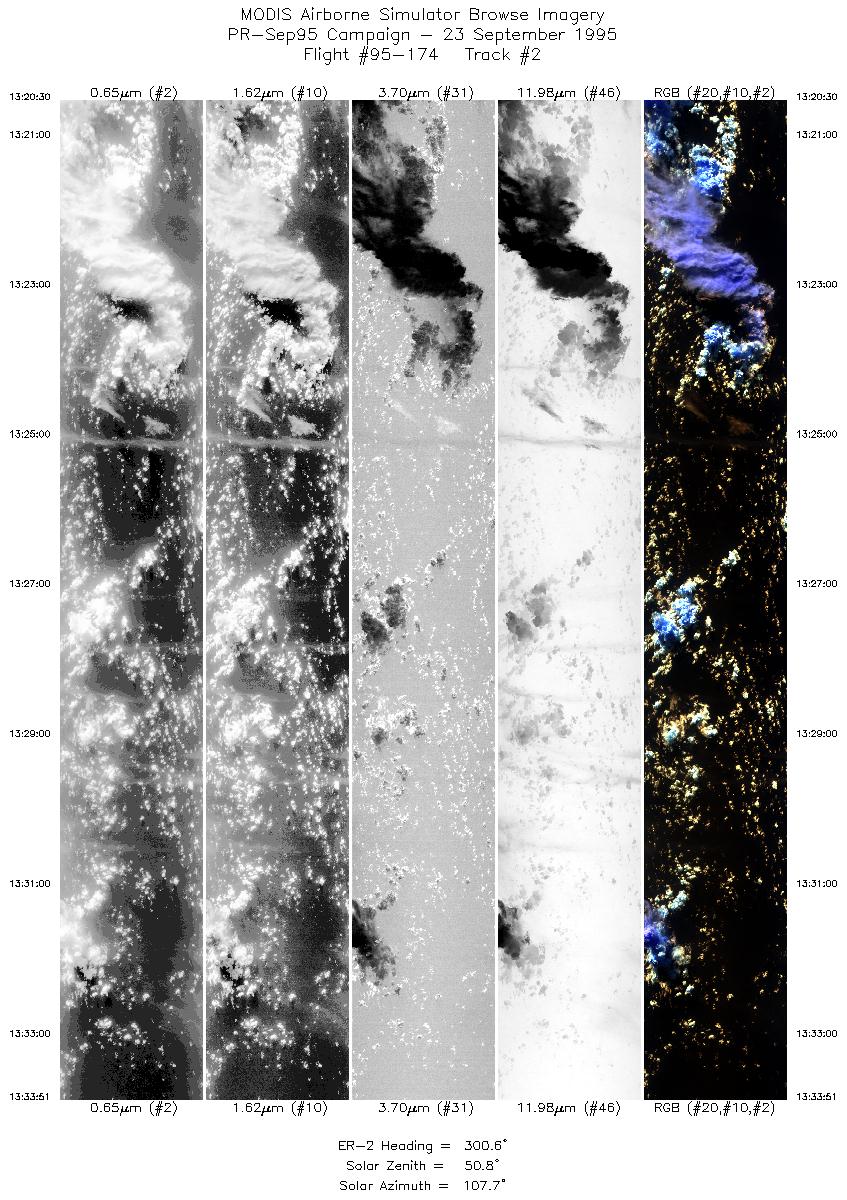
| 2 |
13:20-13:33 |
301 |
20.32-21.10 |
69.77-71.17 |
5000 |
~20000 |
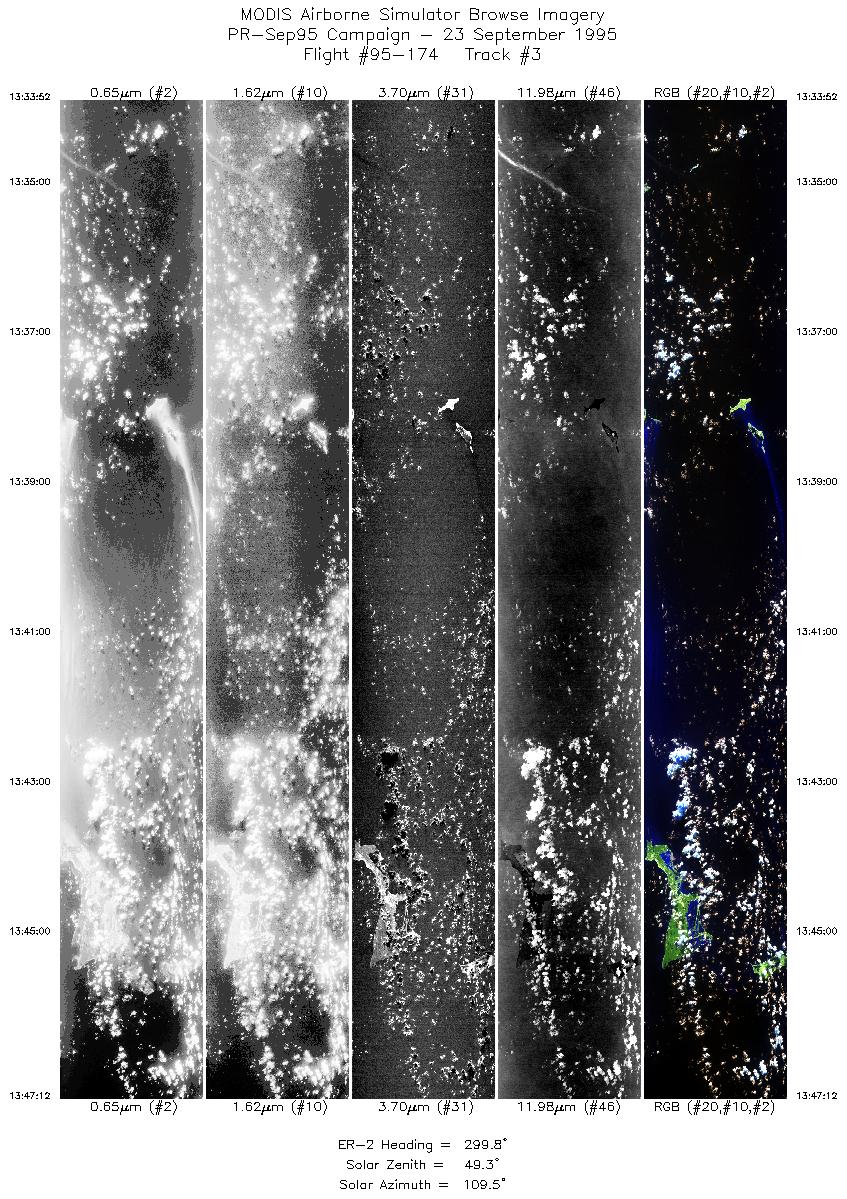
| 3 |
13:33-13:47 |
300 |
21.10-21.86 |
71.18-72.58 |
4996 |
~20000 |
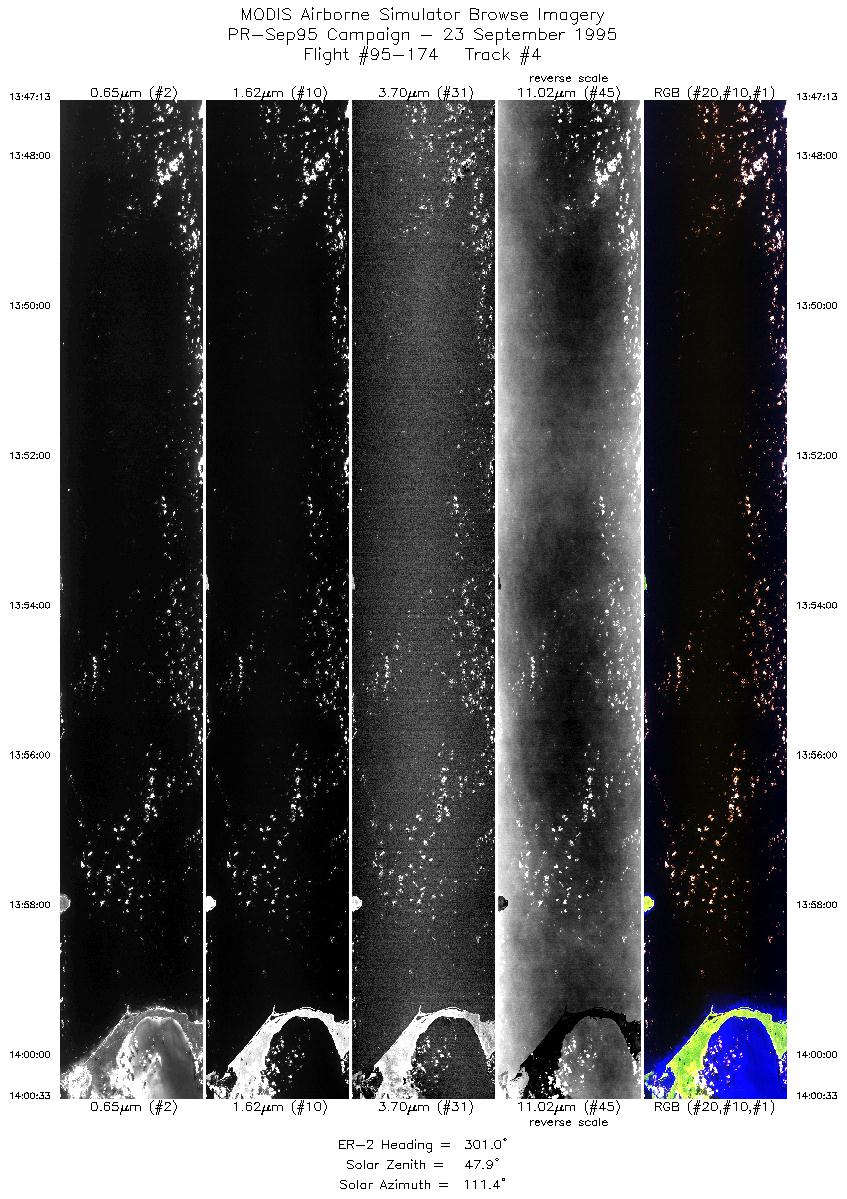
| 4 |
13:47-14:00 |
301 |
21.86-22.59 |
72.58-73.97 |
4997 |
~20000 |
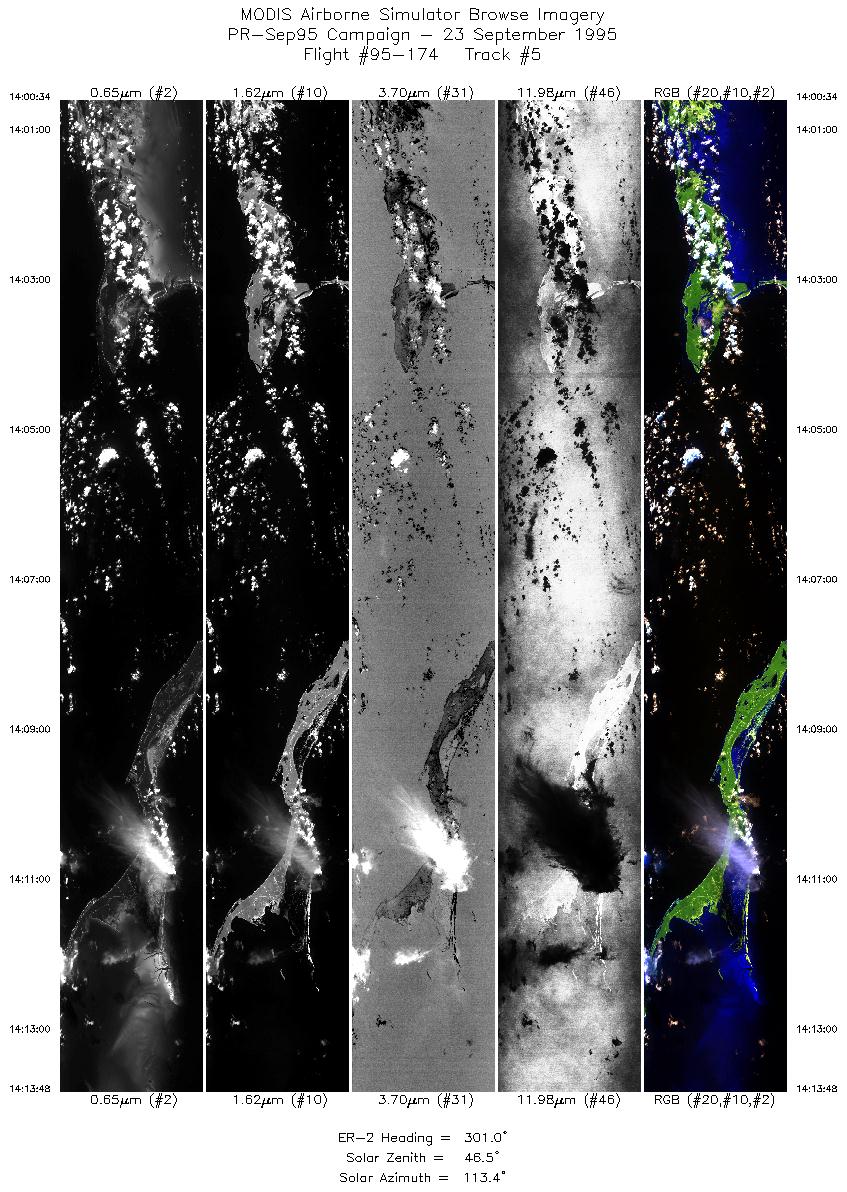
| 5 |
14:00-14:13 |
301 |
22.59-23.32 |
73.98-75.40 |
4962 |
~20000 |
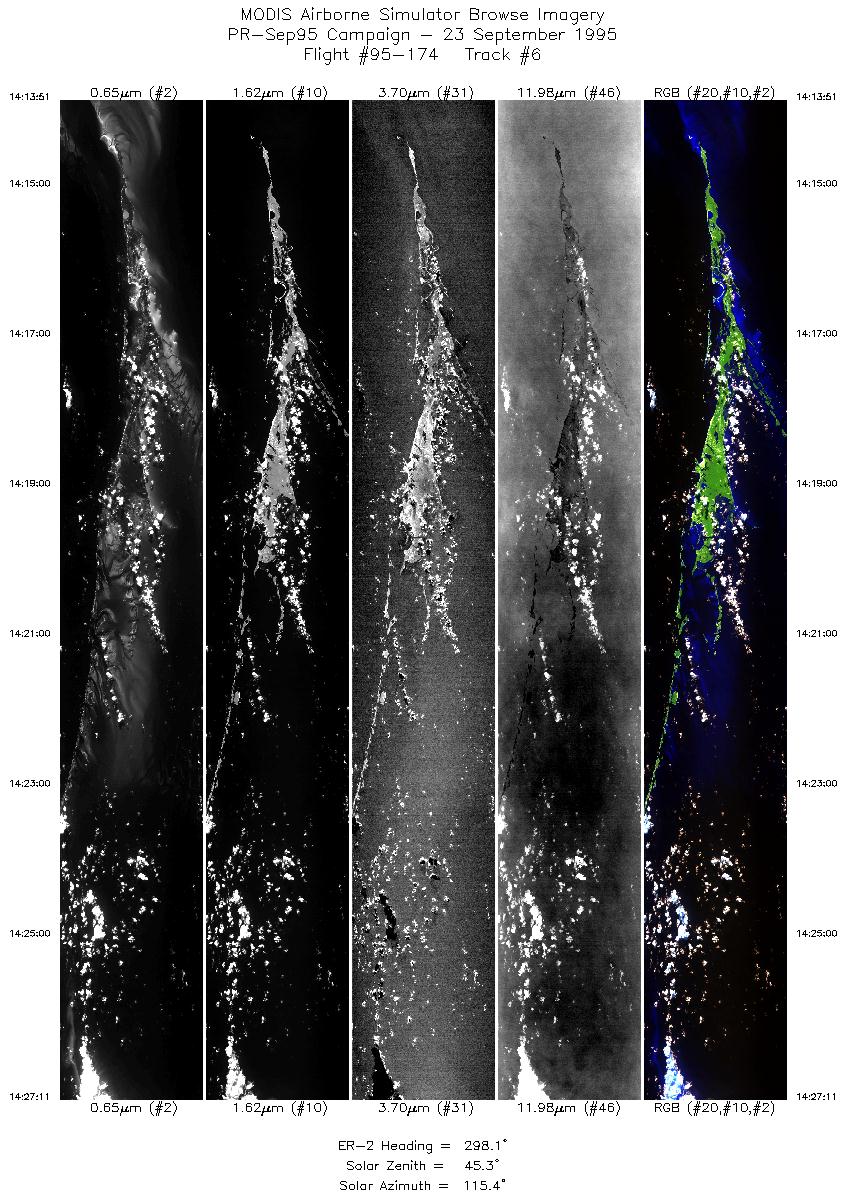
| 6 |
14:13-14:27 |
298 |
23.32-24.07 |
75.41-76.85 |
5000 |
~20000 |
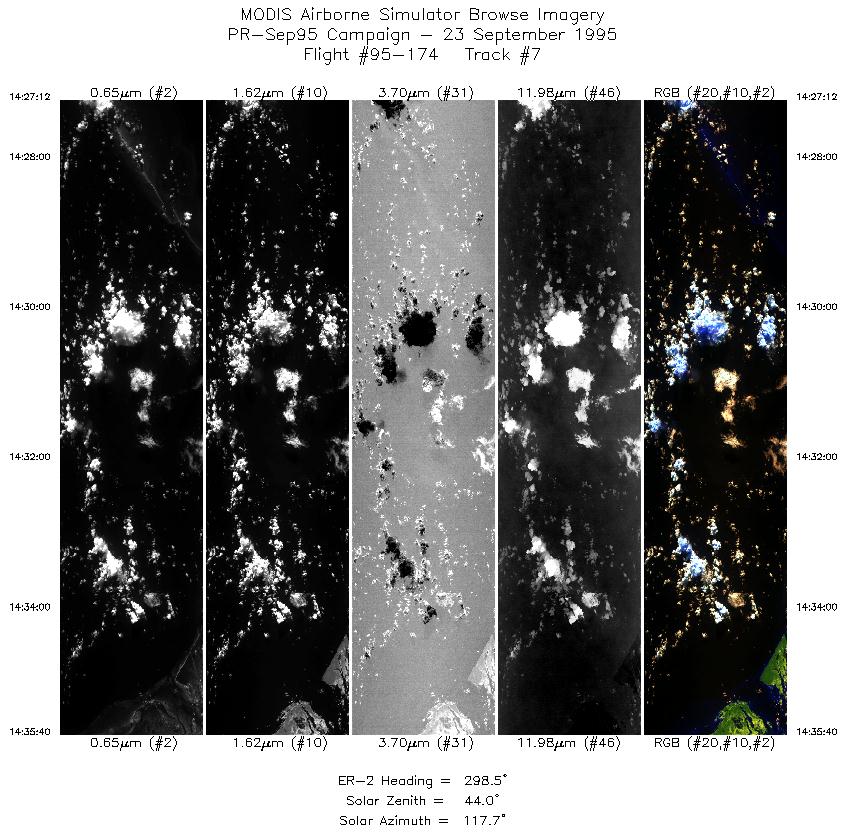
| 7 |
14:27-14:35 |
299 |
24.07-24.53 |
76.85-77.75 |
3175 |
~20000 |
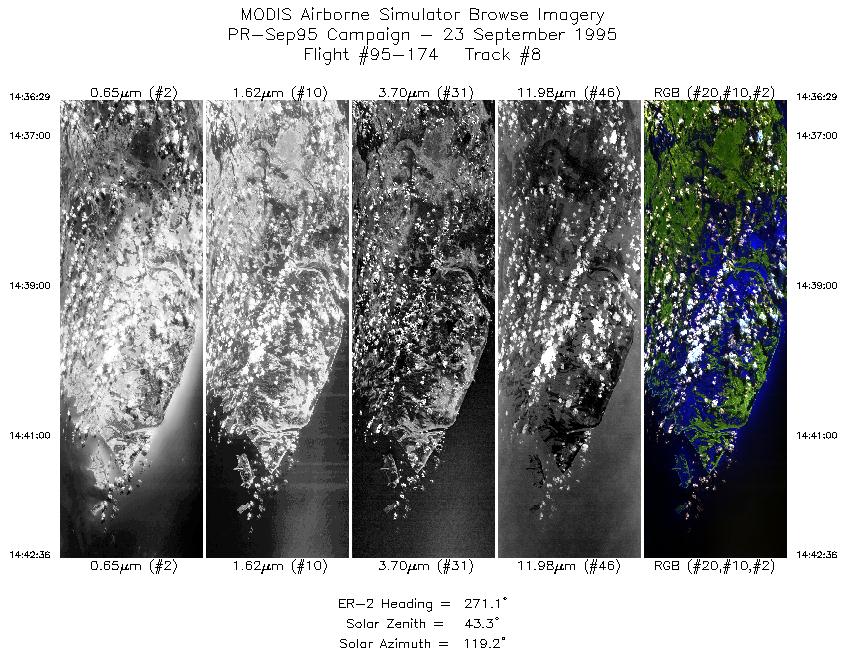
| 8 |
14:36-14:42 |
271 |
24.55-24.59 |
77.85-78.60 |
2294 |
~20000 |
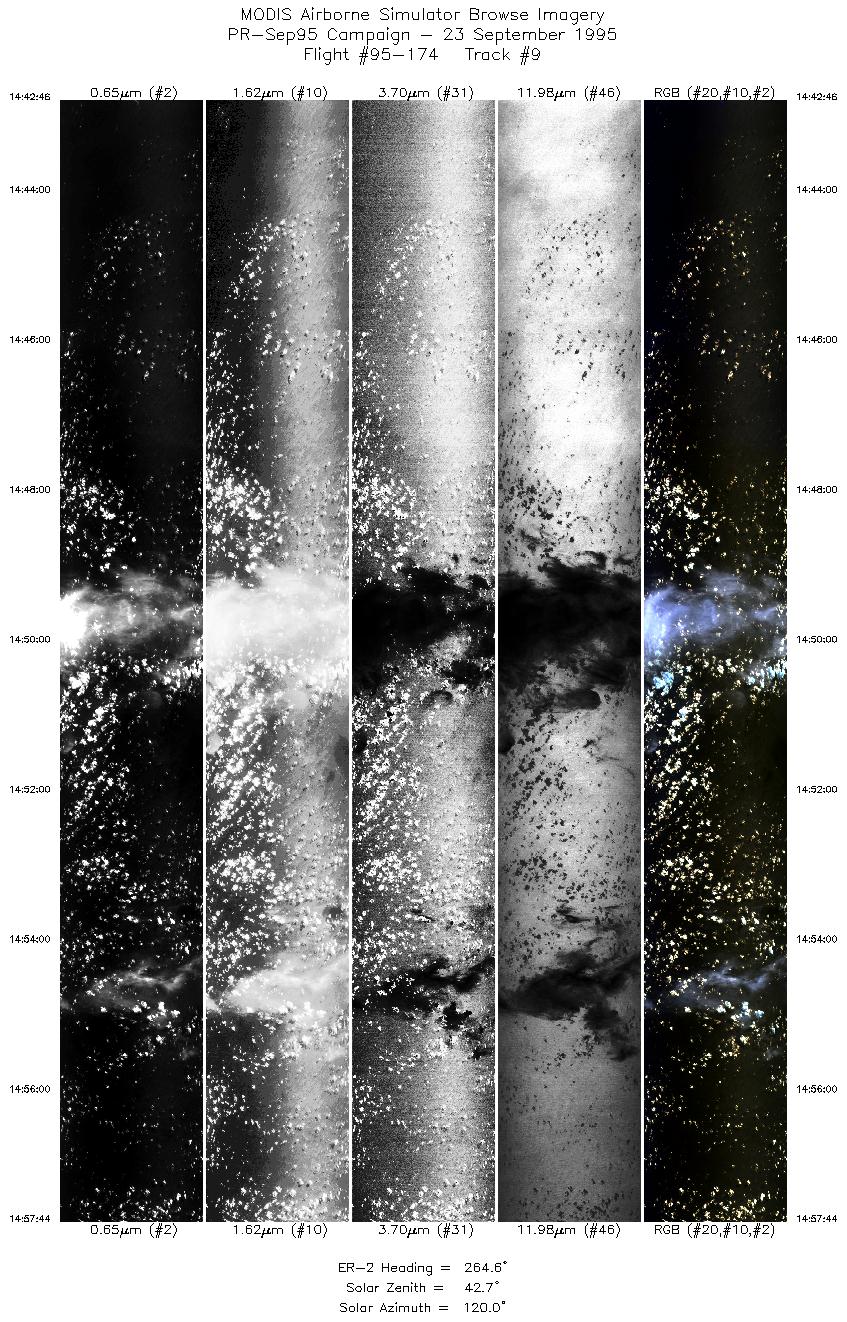
| 9 |
14:42-14:57 |
265 |
24.59-24.49 |
78.62-80.48 |
5614 |
~20000 |
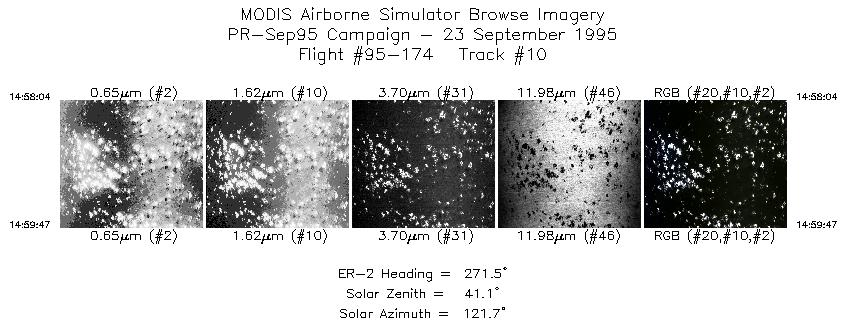
| 10 |
14:58-14:59 |
272 |
24.49-24.50 |
80.53-80.75 |
644 |
~20000 |
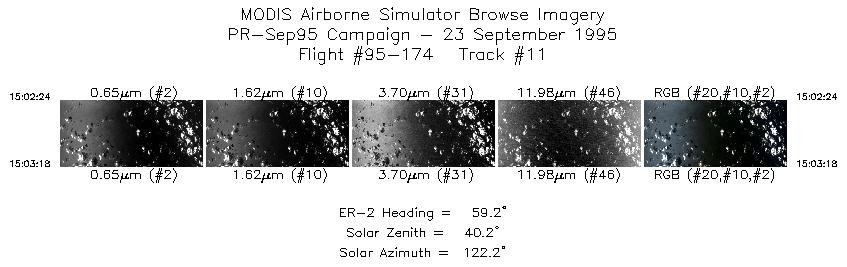
| 11 |
15:02-15:03 |
59 |
24.37-24.41 |
80.75-80.66 |
338 |
~20000 |
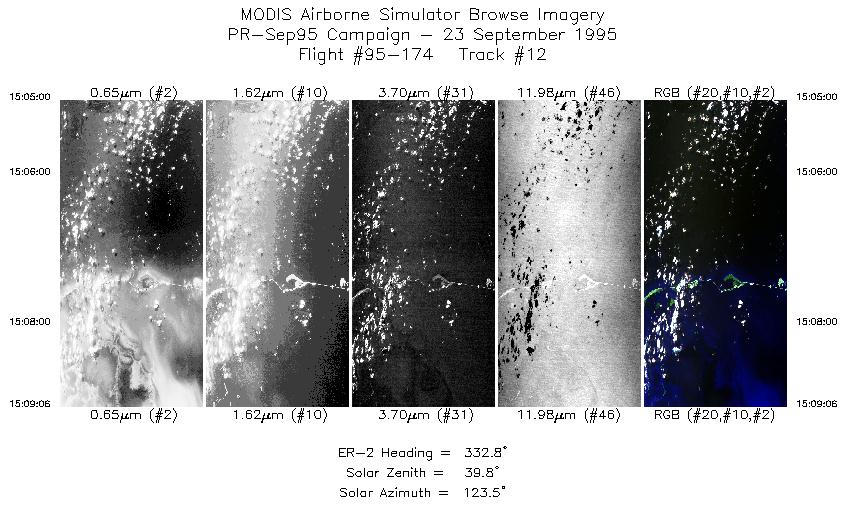
| 12 |
15:05-15:09 |
333 |
24.58-25.00 |
80.63-80.88 |
1538 |
~20000 |
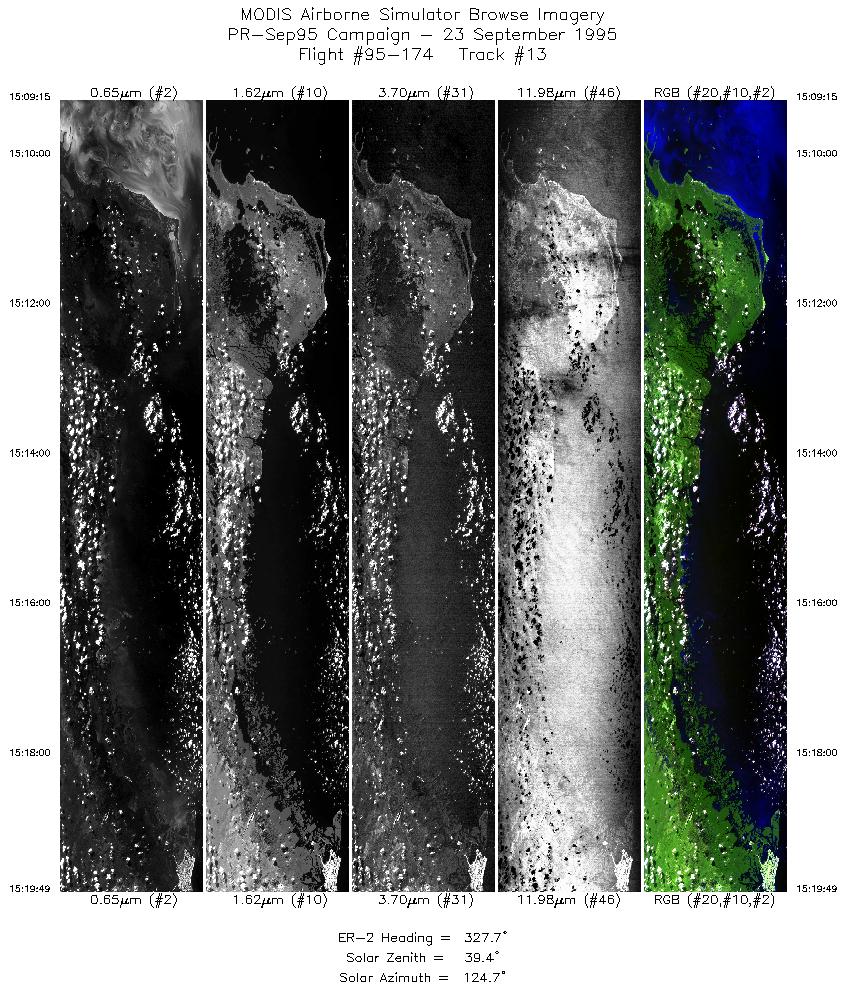
| 13 |
15:09-15:19 |
328 |
25.01-26.02 |
80.89-81.63 |
3963 |
~20000 |
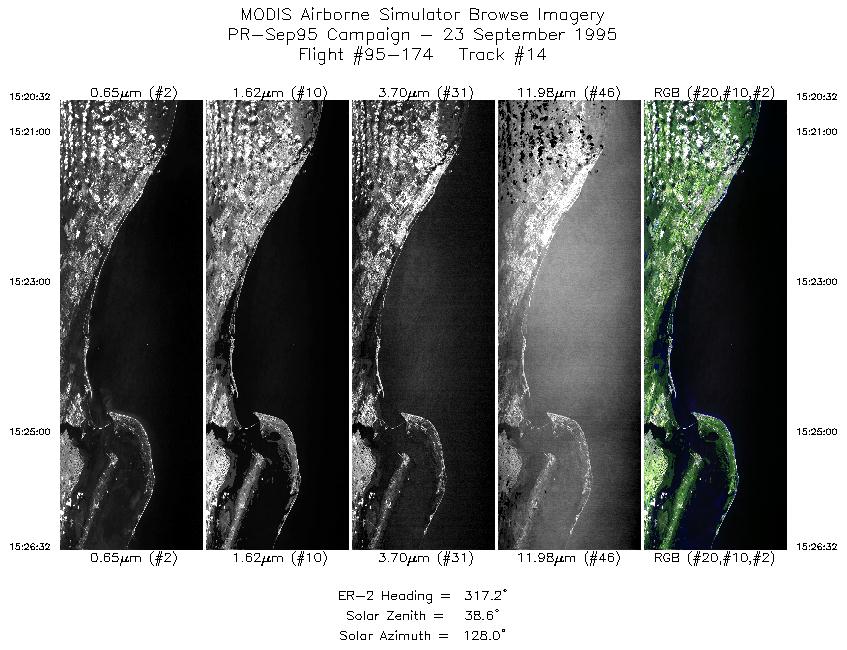
| 14 |
15:20-15:26 |
317 |
26.08-26.56 |
81.69-82.22 |
2250 |
~20000 |
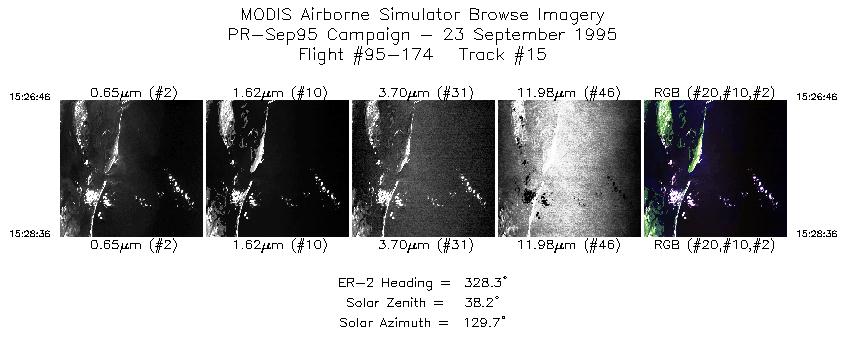
| 15 |
15:26-15:28 |
328 |
26.58-26.76 |
82.24-82.37 |
689 |
~20000 |
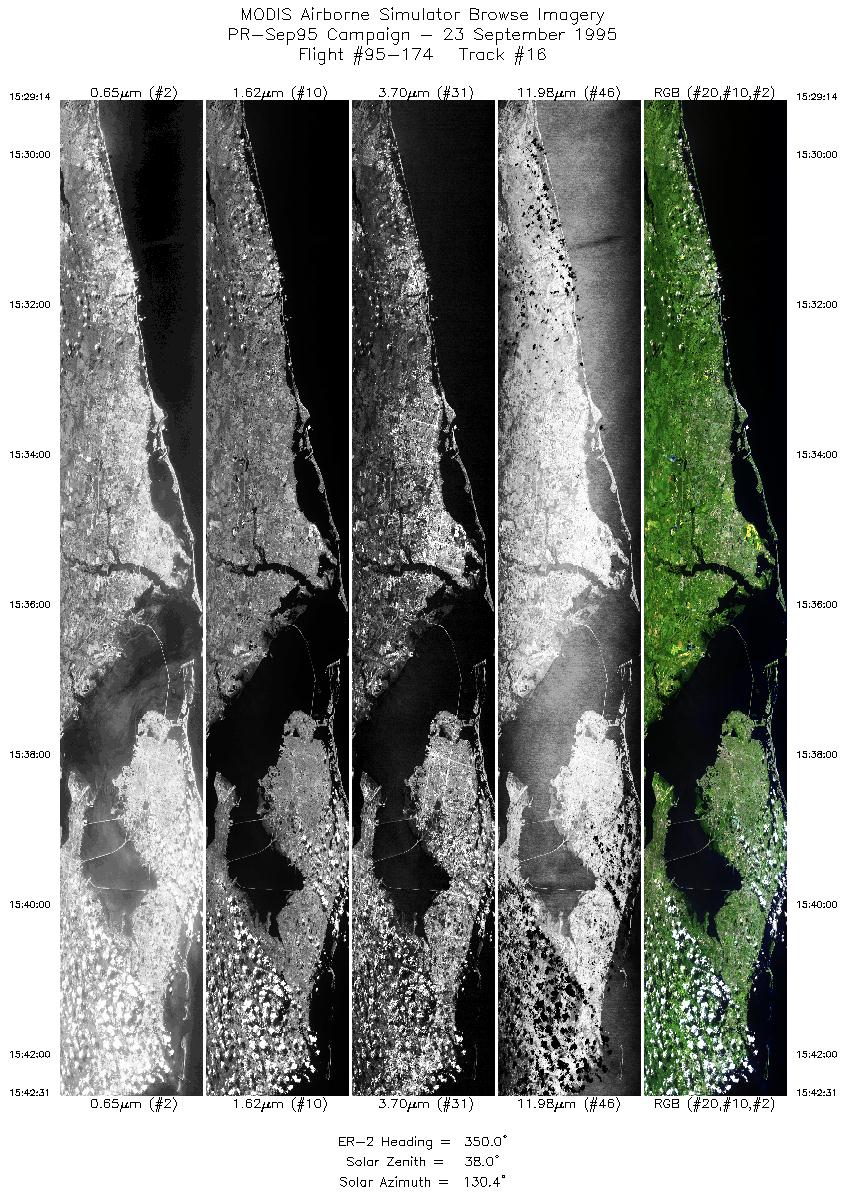
| 16 |
15:29-15:42 |
350 |
26.83-28.26 |
82.39-82.75 |
4981 |
~20000 |
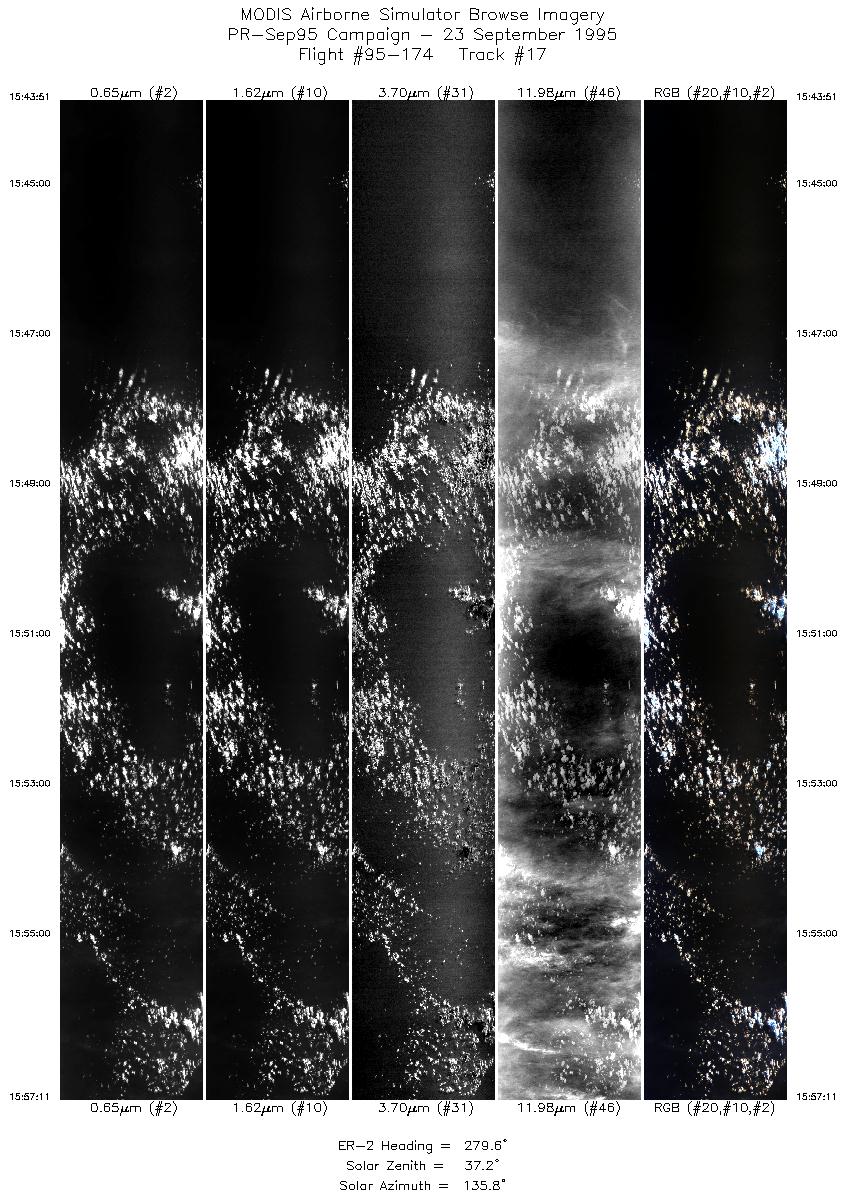
| 17 |
15:43-15:57 |
280 |
28.35-28.59 |
82.86-84.59 |
5000 |
~20000 |
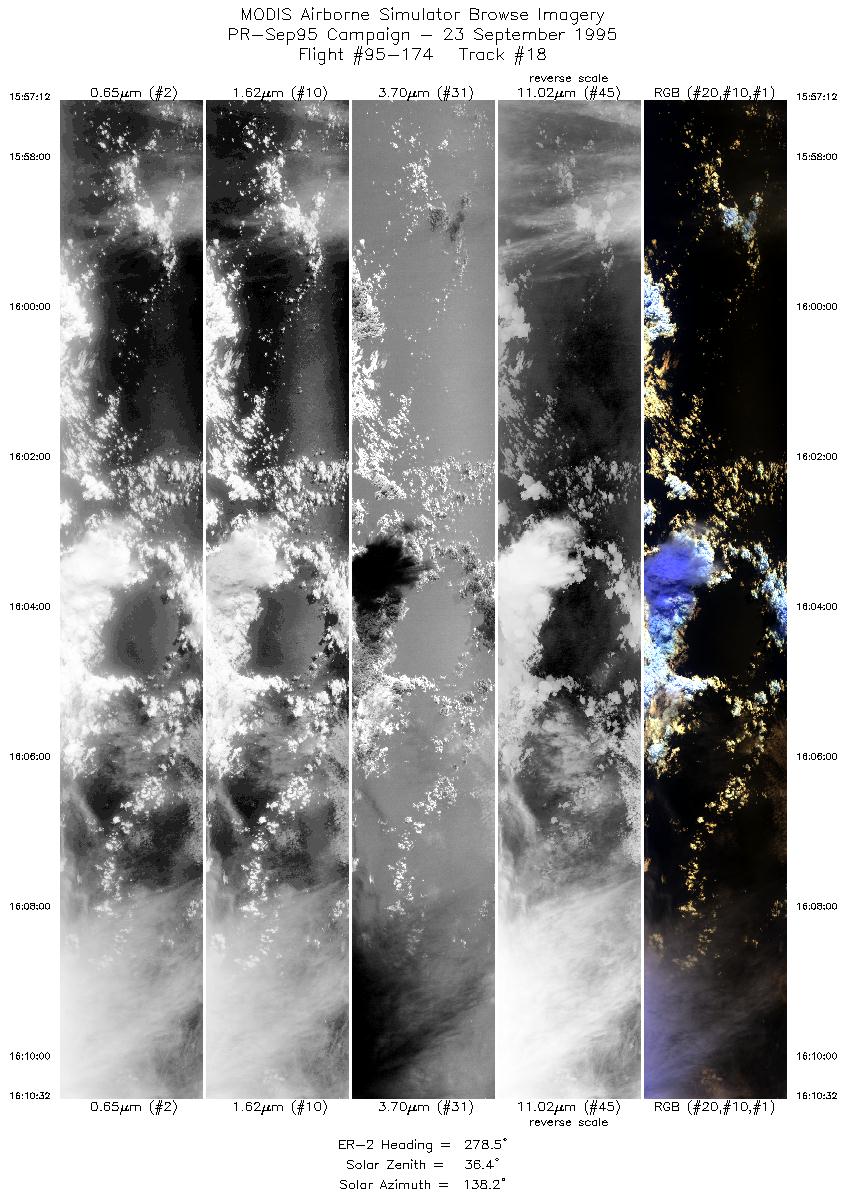
| 18 |
15:57-16:10 |
278 |
28.59-28.80 |
84.59-86.34 |
4999 |
~20000 |
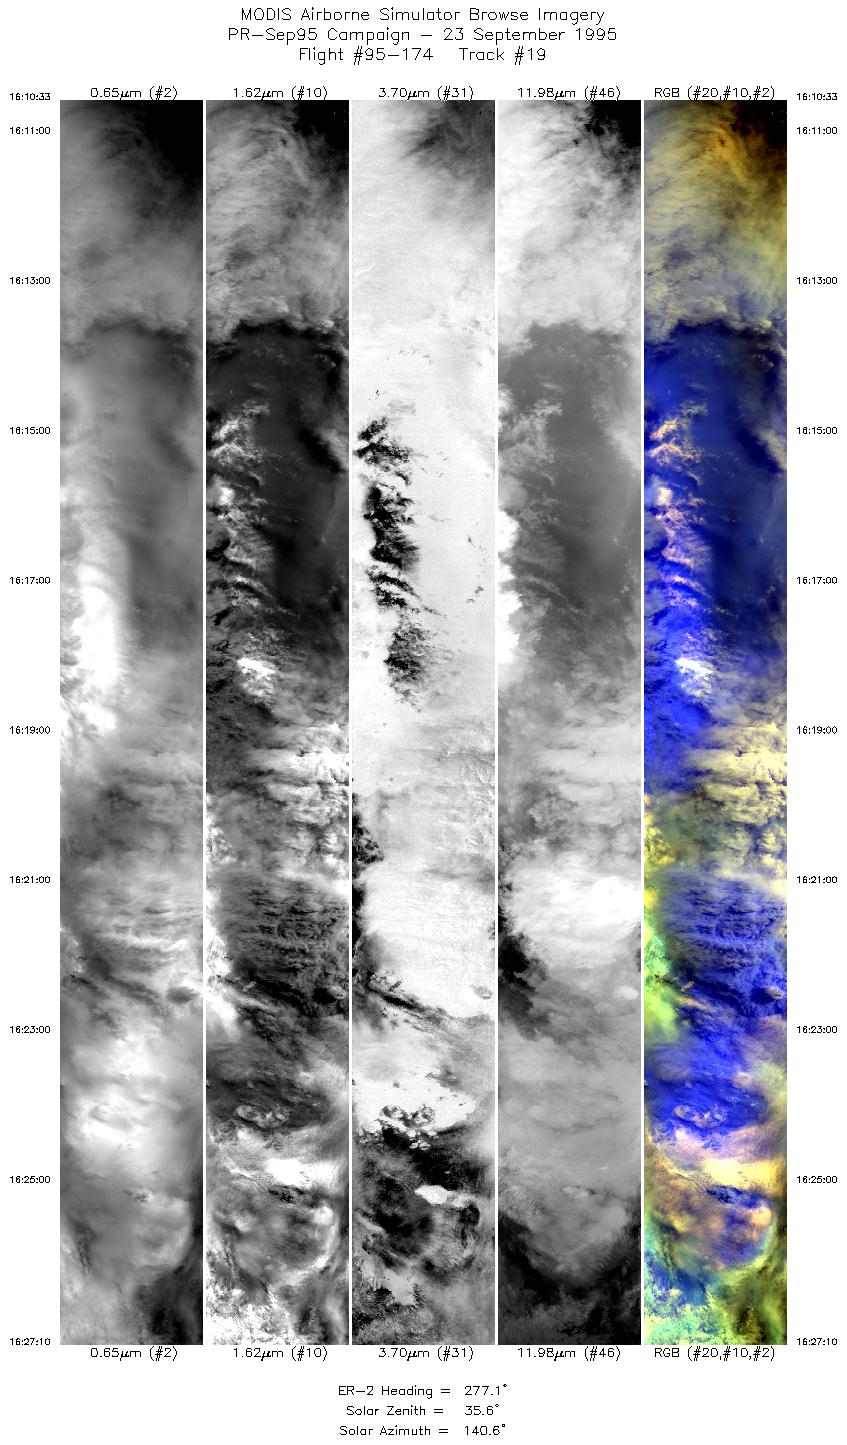
| 19 |
16:10-16:27 |
277 |
28.80-29.05 |
86.35-88.50 |
6229 |
~20000 |
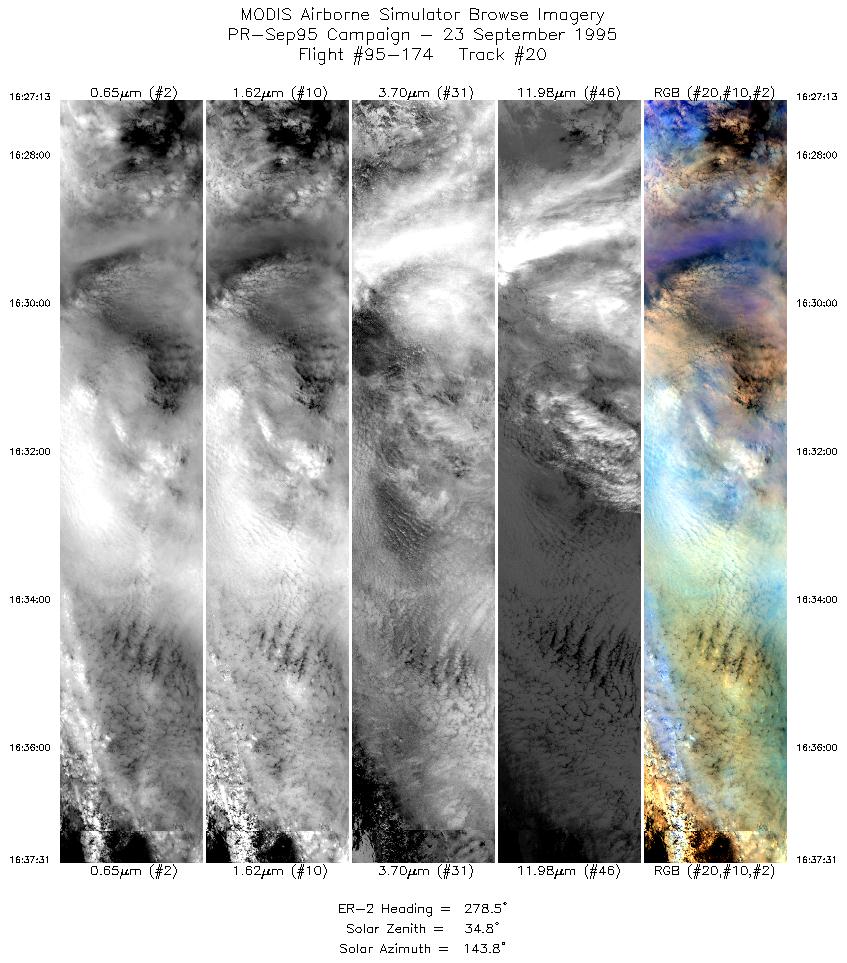
| 20 |
16:27-16:37 |
279 |
29.06-29.25 |
88.50-89.81 |
3817 |
~20000 |
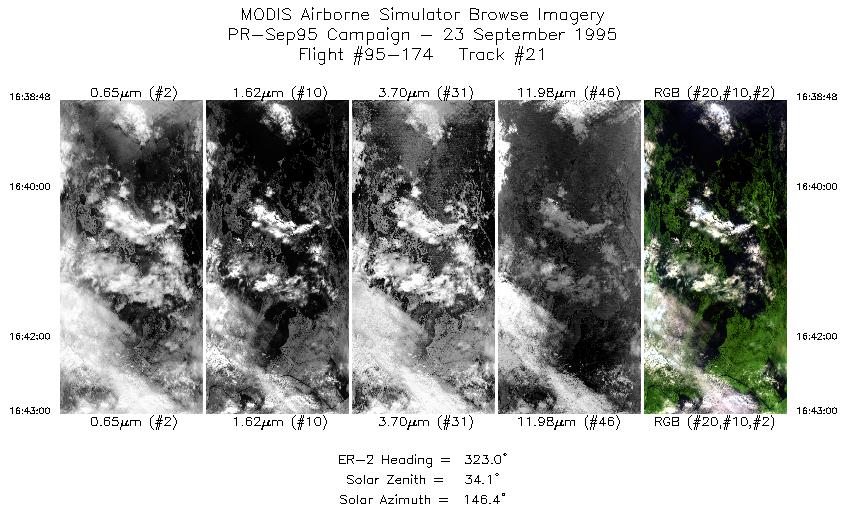
| 21 |
16:38-16:42 |
323 |
29.34-29.71 |
89.93-90.24 |
1574 |
~20000 |
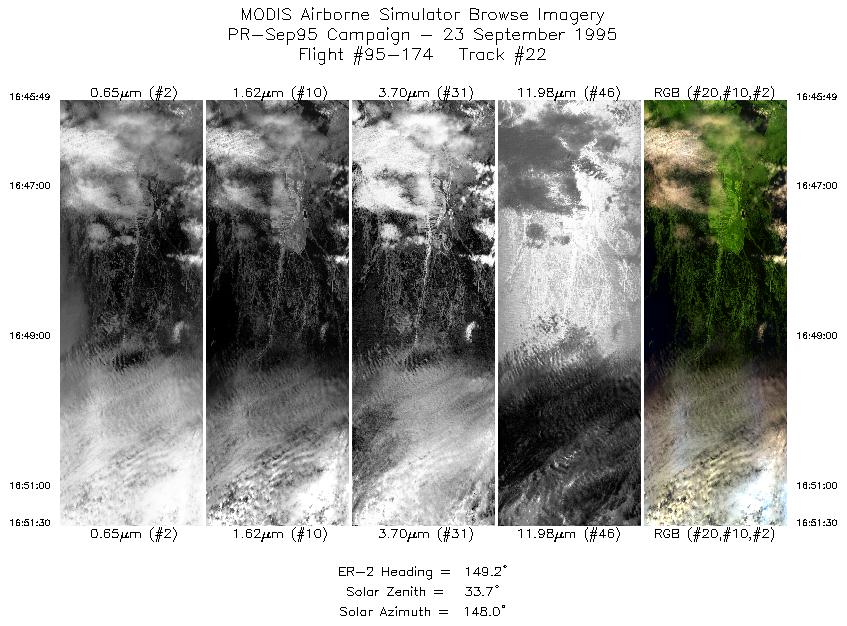
| 22 |
16:45-16:51 |
149 |
29.59-29.01 |
90.40-90.03 |
2131 |
~20000 |
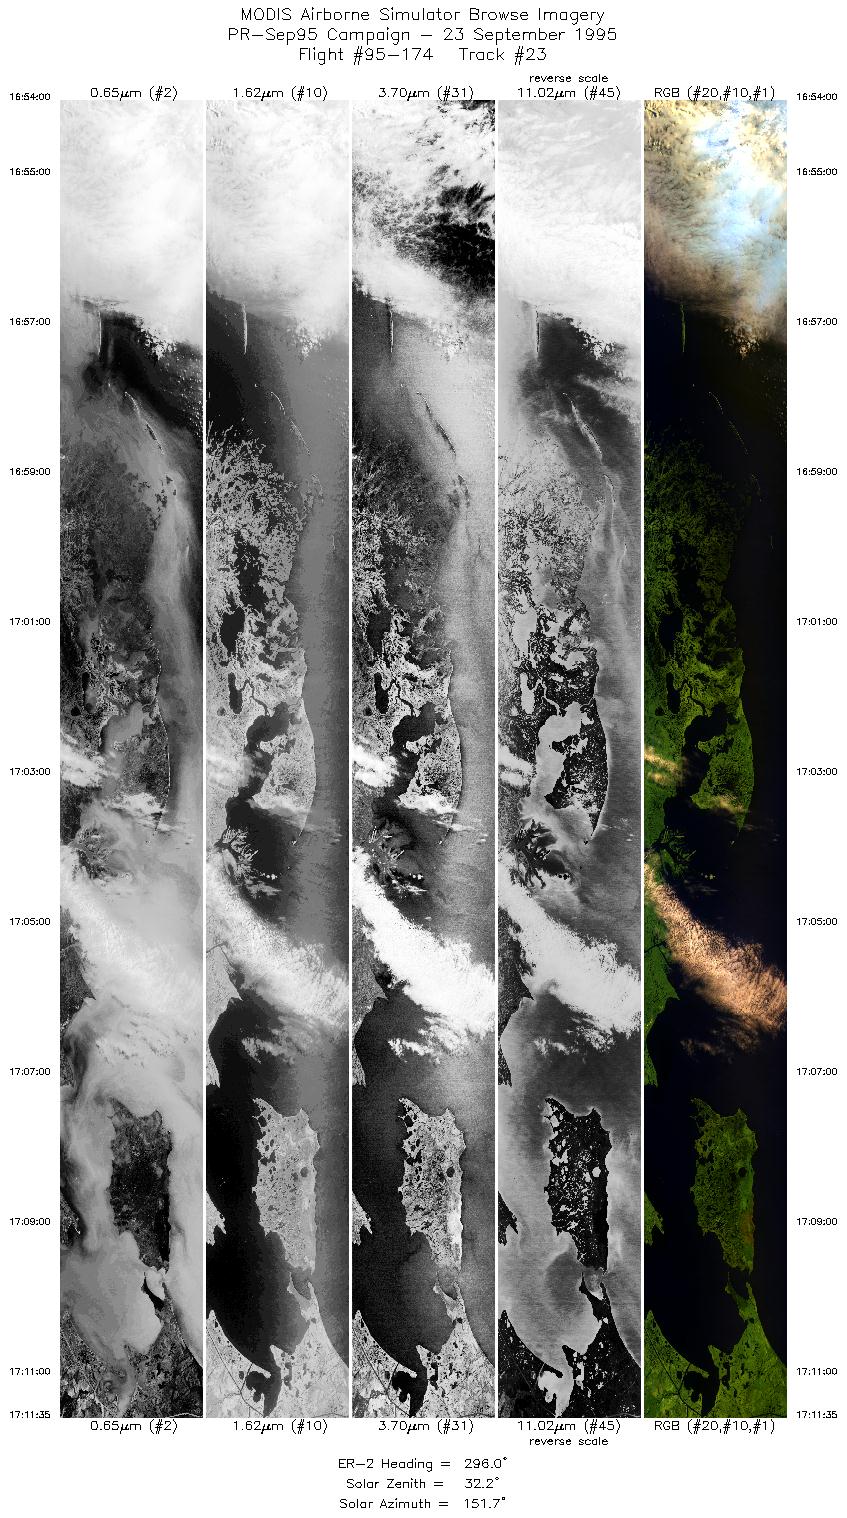
| 23 |
16:54-17:11 |
296 |
28.86-29.73 |
90.19-92.22 |
6590 |
~20000 |
| 24 |
17:12-17:25 |
276 |
29.74-29.91 |
92.27-93.99 |
4997 |
~20000 |
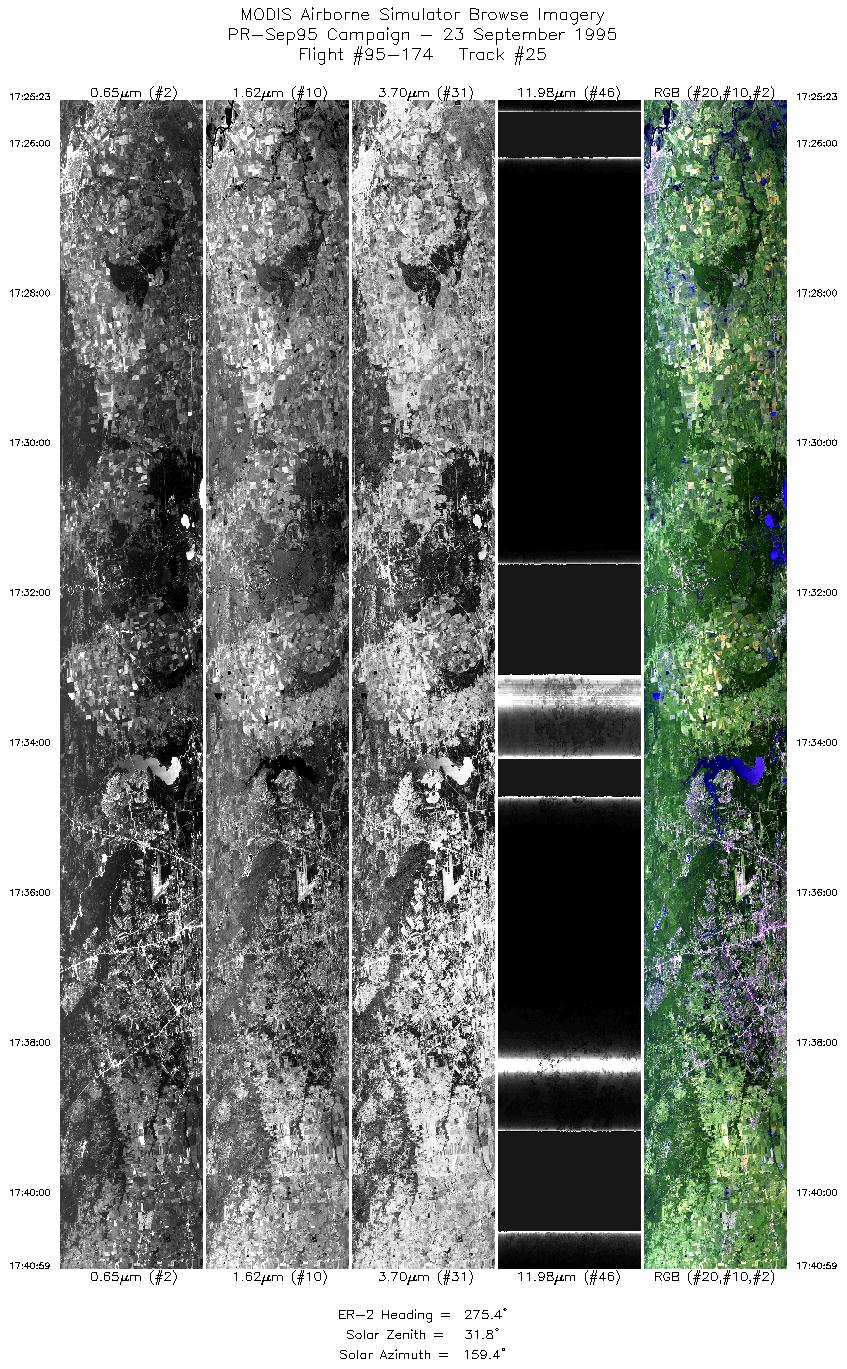
| 25 |
17:25-17:40 |
275 |
29.91-30.08 |
94.00-95.98 |
5847 |
~20000 |
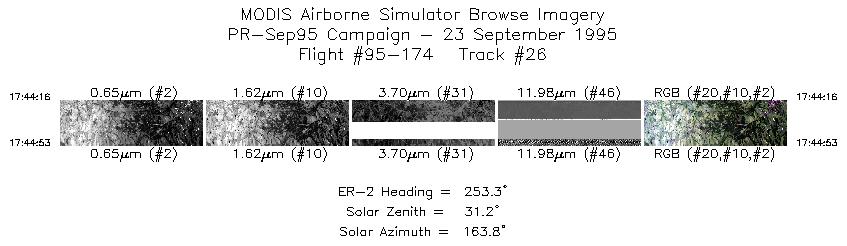
| 26 |
17:44-17:44 |
253 |
30.03-30.01 |
96.29-96.34 |
232 |
~20000 |
|
Images 01 through 26 in sequence |
Data Evalutation
Track 20 has dropped scanlines due to inflight switch of data recorders.
Track 20 through end of flight, port 4 channels have numerous bad scanlines,
increasing in severity as flight progresses. By the end of the mission, port
3 channels area affected also.
Spectral Summary
Spectral Band Configuration
Spectral Response Files
Level-1B Data Distribution
NASA Goddard Space Flight Center DAAC
Related Web Sites
Airborne Sensors Facility Page
NASA ER-2 Aircraft Program
|
|