
|
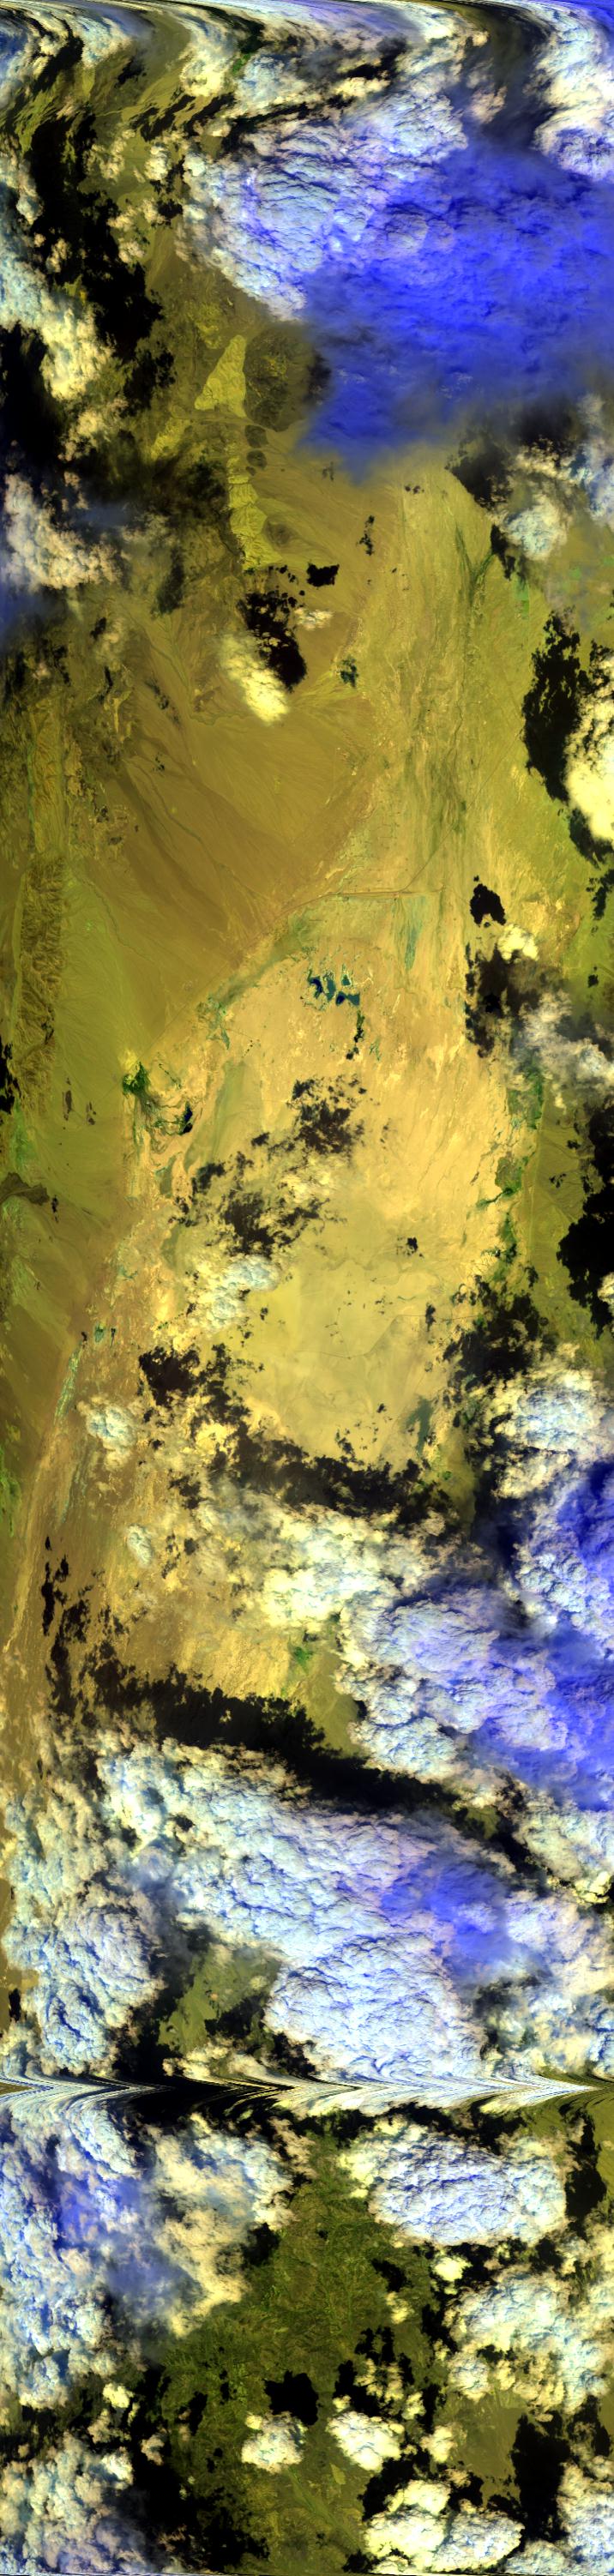
Sample Image

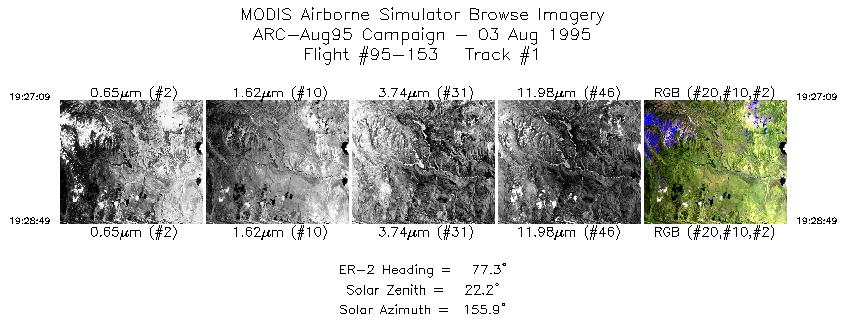
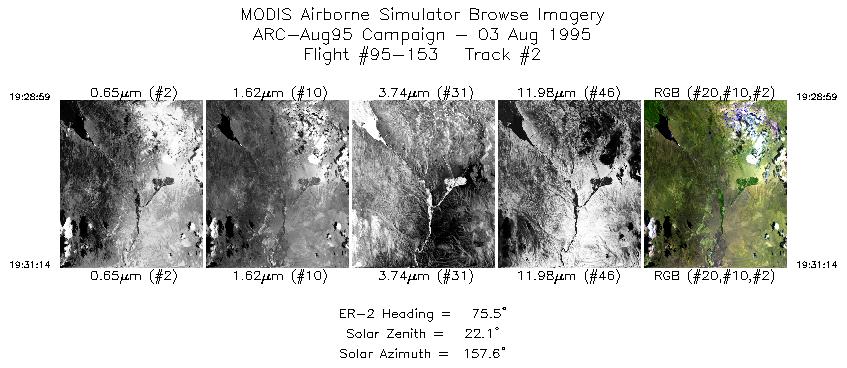
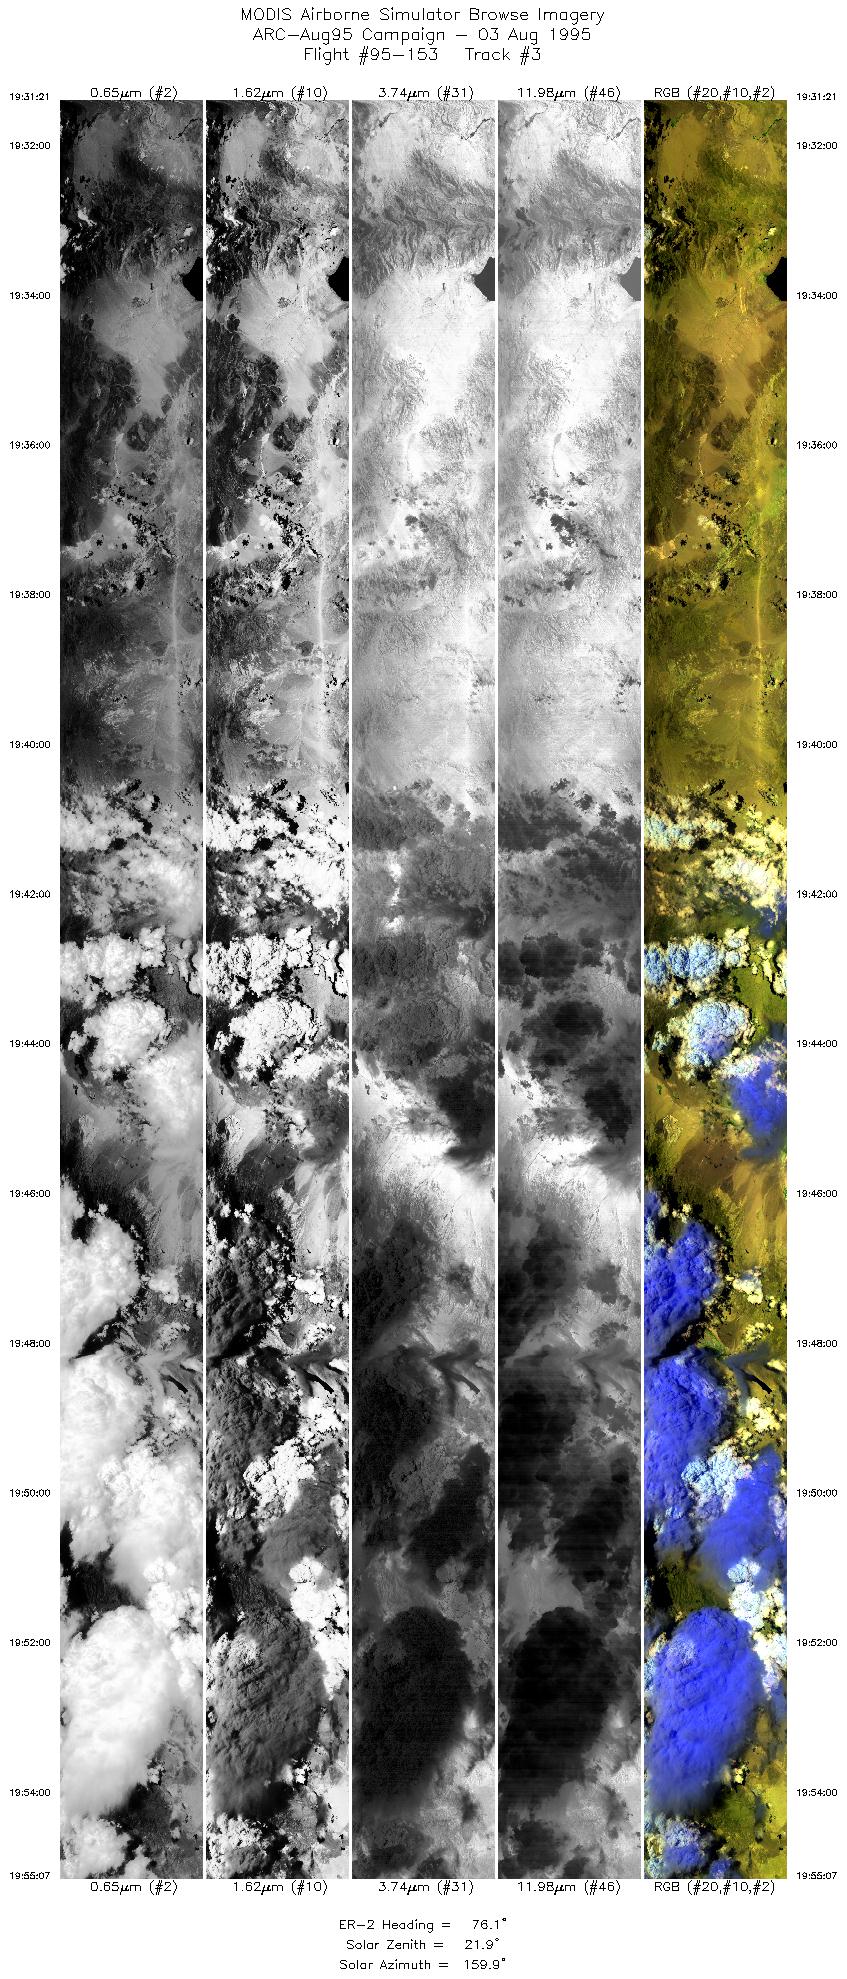
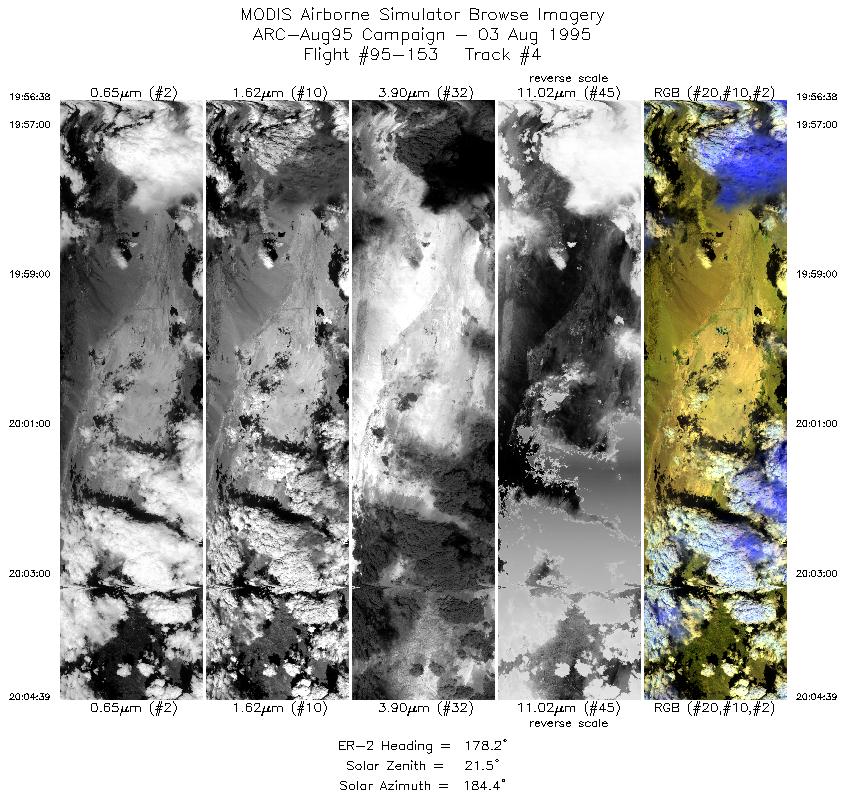
03 Aug 1995
Track #04
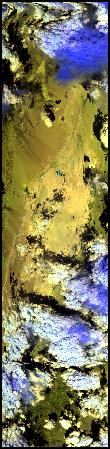
Broken clouds over Railroad Valley, NV. Foothills of the Pancake Range to the extreme left (west).
R: 2.14 microns
G: 1.62 microns
B: 0.55 microns
|
|
Mission Summary
Date: August 03, 1995
ER-2 Flight Number: 95-153
Deployment: ARC-Aug95
Flight Location: Railroad Valley, Nevada
Principal Investigator: Dr. Zhengming Wan (UCSB)
Additional Sensors: 12" RC-10 (CIR)
Objective: Validation of an algorithim used to calculate land surface temperatures and emissivity based on thermal infrared data.
Level-1B Processing Information
Level-1B Data processed by: Ames Research Center
Level-1B Data Version: #09
Level-1B Configuration: (sample file)
Calibration Type: Final
Calibration Version: 1.0
Temperature Adjustment: 24C
Status: Completed with final calibration
|
|
Flight Track Map

|
Level-1B Browse Imagery
Straight Line Flight Tracks: 4
Scanlines Processed: 13365
Solar Azimuth and Zenith Angles
|
Browse Images
|
Click on the Flight Track number to load images.
Lat/Lon ranges are for the BEG-END scanline nadir pixels.
|
Flight
Track |
Time_Span
(GMT) |
Heading
(Deg) |
Lat_Range
(Deg_N) |
Lon_Range
(Deg_W) |
Length
(Scanlines) |
Altitude
(Meters) |
| 1 |
19:27-19:28 |
77 |
38.35-38.39 |
119.58-119.35 |
621 |
~20000 |
| 2 |
19:28-19:31 |
76 |
38.39-38.46 |
119.33-119.02 |
842 |
~20000 |
| 3 |
19:31-19:55 |
76 |
38.46-39.05 |
119.00-115.79 |
8898 |
~20000 |
| 4 |
19:56-20:04 |
178 |
38.94-38.03 |
115.65-115.65 |
3004 |
~20000 |
|
Images 01 through 04 in sequence |
Data Evalutation
In track 1 channels 48-50 show banding that is possibly 400Htz noise. Track 4 is smeared at the start of the flightline. Channels 42 and 48 show port 4 blowoff and subsequent failure (black banding and white background). Channel 49 shows noise-like banding.
Spectral Summary
Spectral Band Configuration
Spectral Response Files
Level-1B Data Distribution
NASA Goddard Space Flight Center DAAC
Related Web Sites
Airborne Sensors Facility Page
NASA ER-2 Aircraft Program
|
|