
|
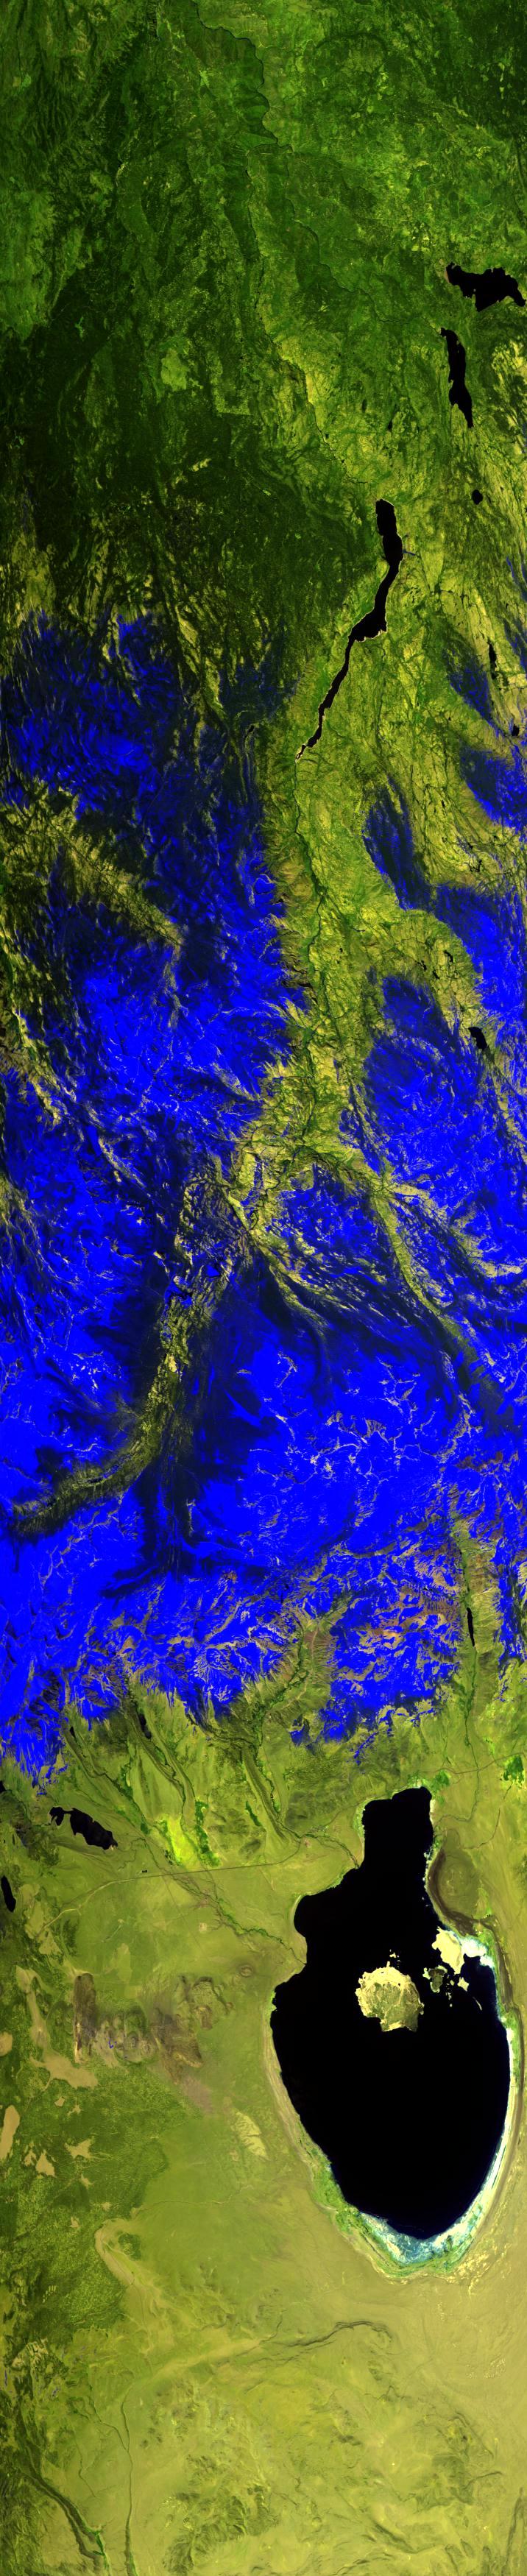
Sample Image

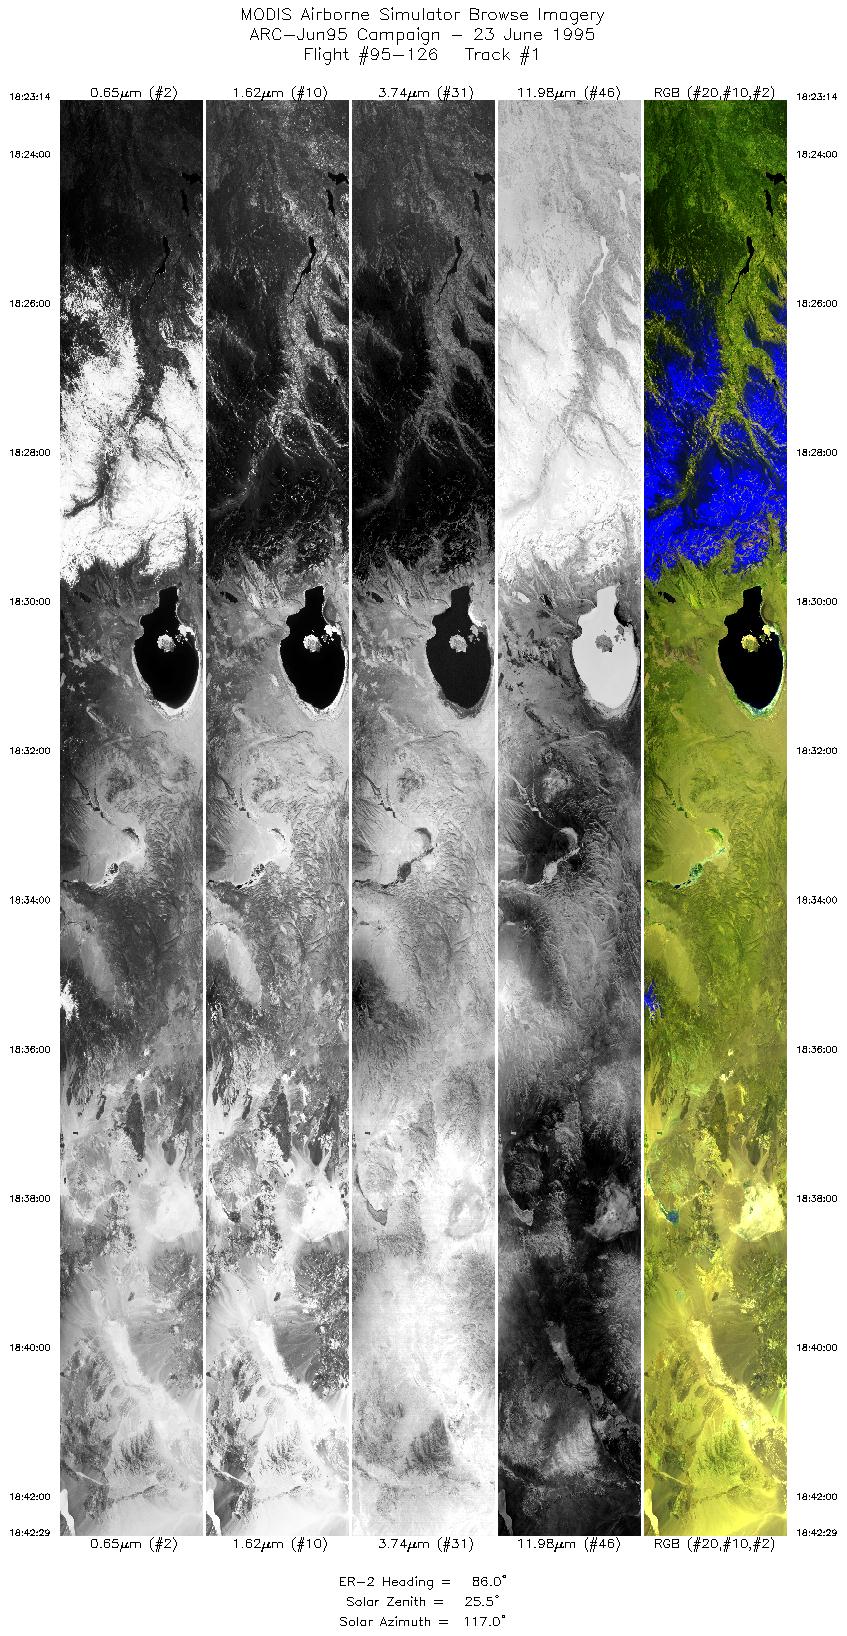
23 June 1995
Track #01
scanlines 1-3500 of 7180
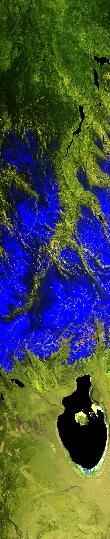
Snow covered Sierra Nevada Mountians (in blue), west of Mono Lake.
R: 2.14 microns
G: 1.62 microns
B: 0.55 microns
|
|
Mission Summary
Date: June 22, 1995
ER-2 Flight Number: 95-126
Deployment: ARC-Jun95
Flight Location: Death Valley, CA; Cuprite, NV
Principal Investigators: Dr. James Crowley (USGS), Dr. Roger Clark (USGS), Dr. Robert Green (JPL), Dr. Fred Kruse (AIG)
Additional Sensors: 12" RC-10 (CIR), AVIRIS
Objective: Data used with ground based observations to study debris flows and other mass-wasting geologic events associated with hydorthermally-altered rocks at selected volcanic sites (Crowley). Support Shuttle Imaging Radar in developing data sets for lithographic mapping (Kruse). Data used to validate and calibrate the AVIRIS instrument for eventual comparison to data collected by the HSI sensor onboard the Lewis satellite (Green). Assist the National Park Service in aquiring information concerning soil and rock composition; vegitation type, density, and vigor; animal and plant habitat; anthropological impact; and other ecological data (Clark).
Level-1B Processing Information
Level-1B Data processed by: Ames Research Center
Level-1B Data Version: #09
Level-1B Configuration: (sample file)
Calibration Type: Final
Calibration Version: 1.0
Temperature Adjustment: 35C
Status: Completed with final calibration
|
|
Flight Track Map

|
Level-1B Browse Imagery
Straight Line Flight Tracks: 7
Scanlines Processed: 27383
Solar Azimuth and Zenith Angles
|
Browse Images
|
Click on the Flight Track number to load images.
Lat/Lon ranges are for the BEG-END scanline nadir pixels.
|
Flight
Track |
Time_Span
(GMT) |
Heading
(Deg) |
Lat_Range
(Deg_N) |
Lon_Range
(Deg_W) |
Length
(Scanlines) |
Altitude
(Meters) |
| 1 |
18:23-18:42 |
86 |
37.89-38.03 |
120.05-117.35 |
7180 |
~20000 |
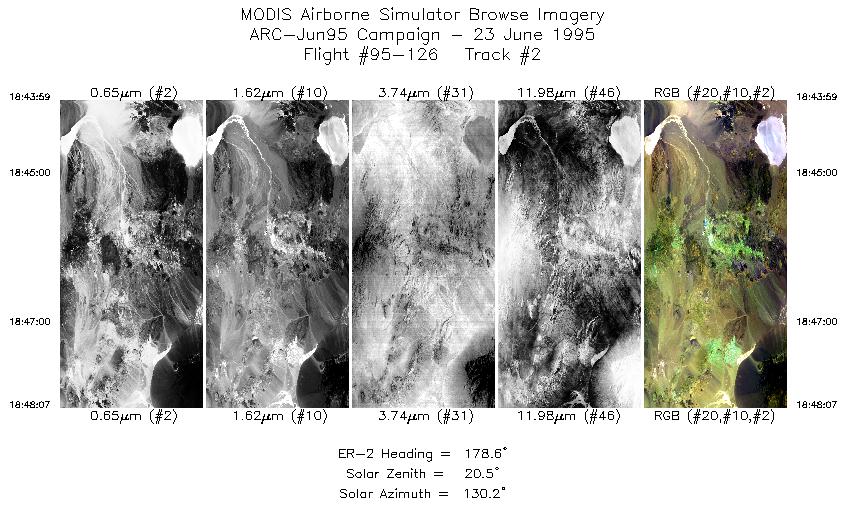
| 2 |
18:43-18:48 |
179 |
37.93-37.46 |
117.20-117.20 |
1543 |
~20000 |
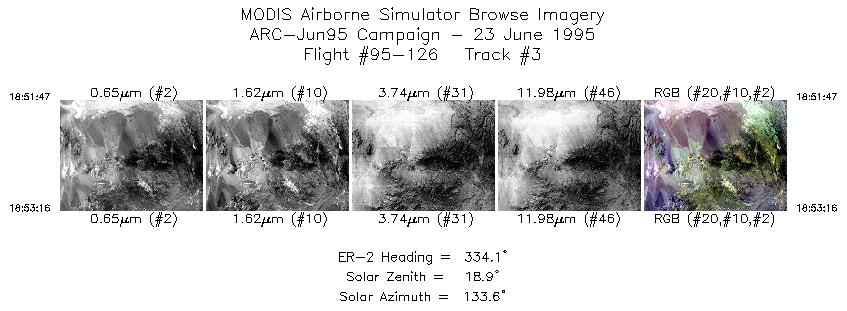
| 3 |
18:51-18:53 |
334 |
37.35-37.50 |
117.46-117.56 |
555 |
~20000 |
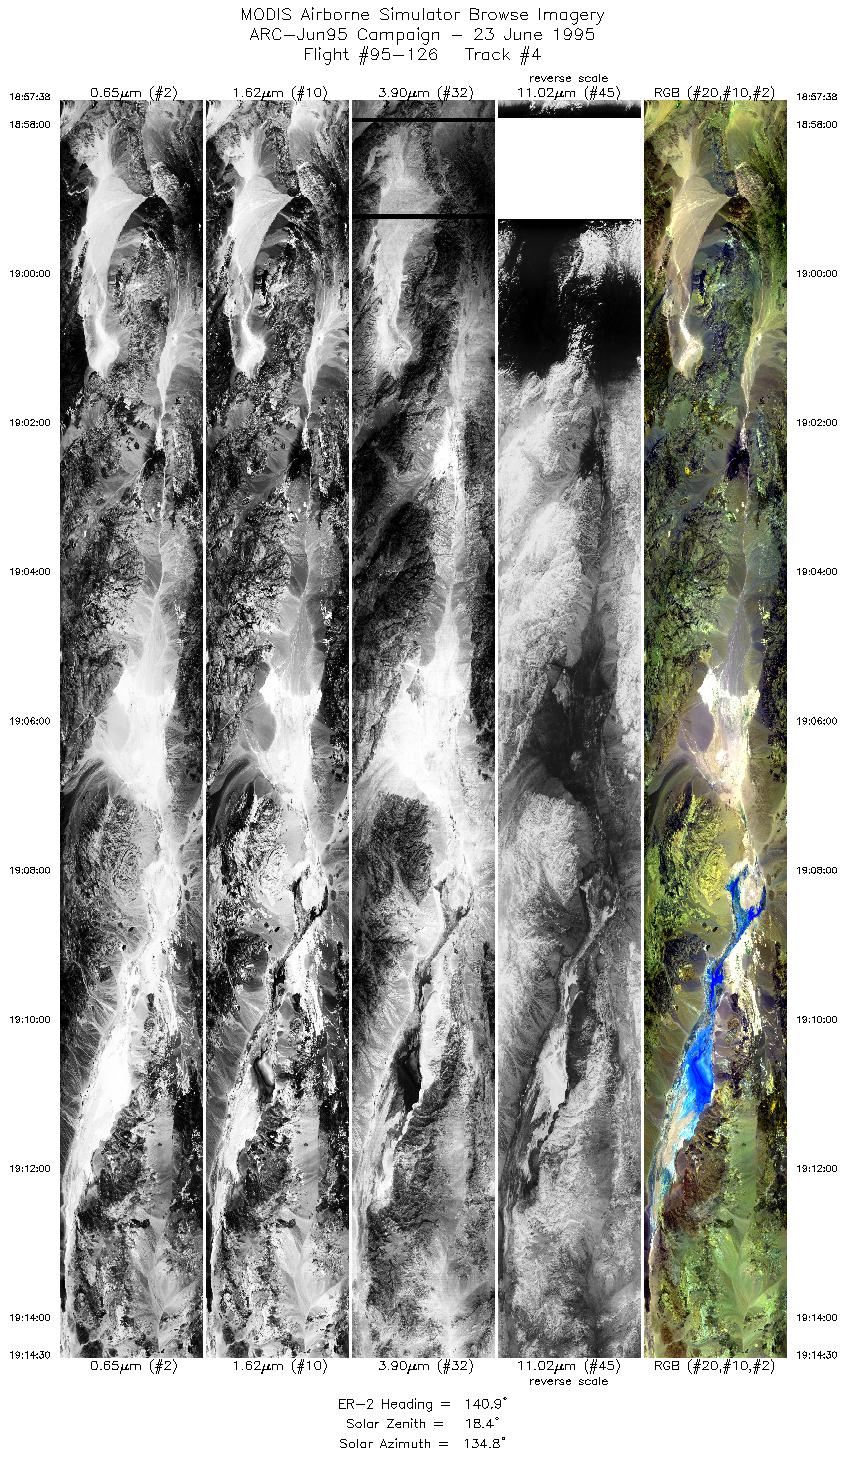
| 4 |
18:57-19:14 |
141 |
37.43-35.94 |
117.91-116.46 |
6294 |
~20000 |
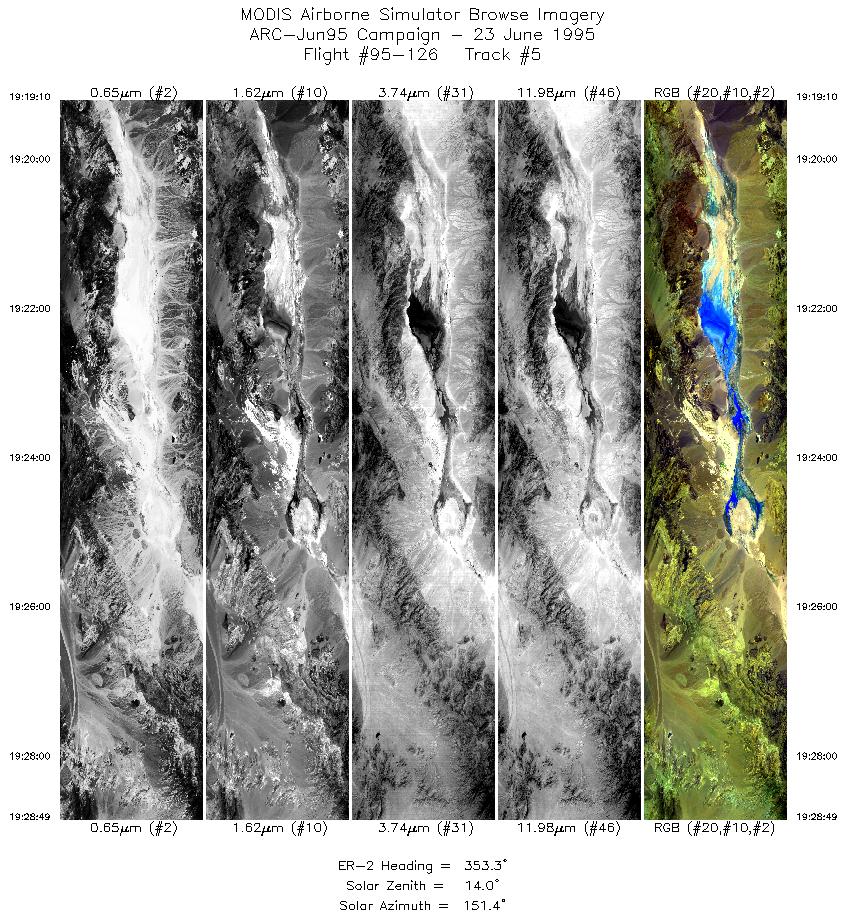
| 5 |
19:19-19:28 |
353 |
35.92-36.99 |
116.77-116.96 |
3601 |
~20000 |
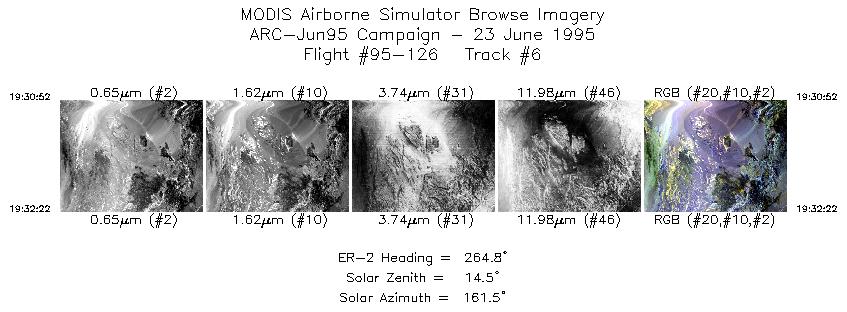
| 6 |
19:30-19:32 |
265 |
37.12-37.11 |
117.17-117.39 |
561 |
~20000 |
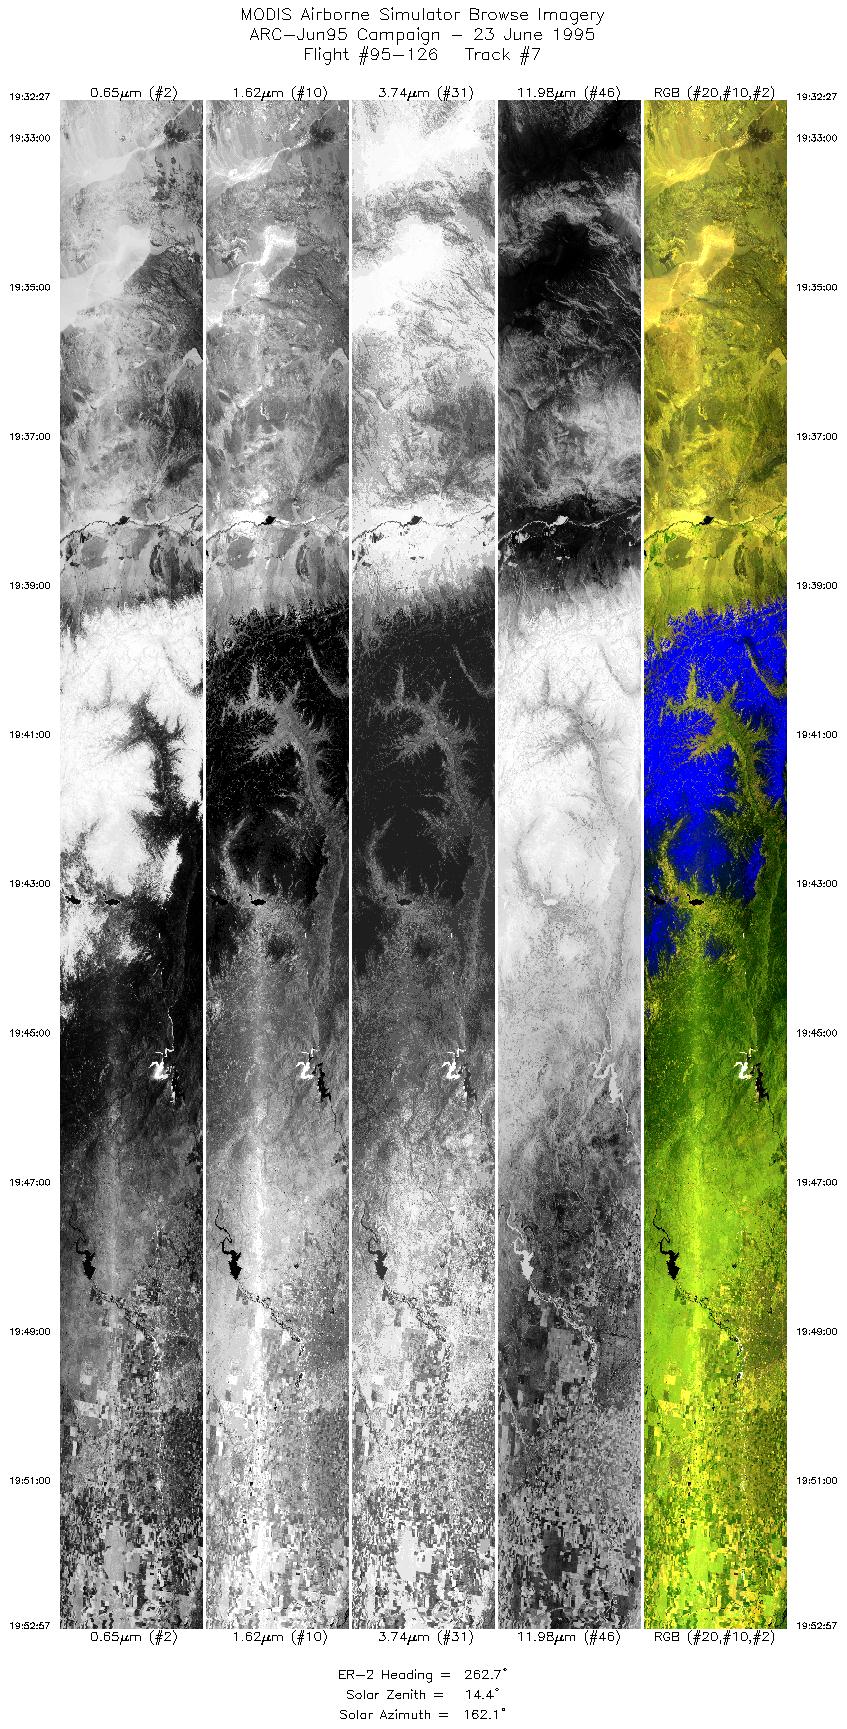
| 7 |
19:32-19:52 |
263 |
37.11-36.85 |
117.40-120.37 |
7649 |
~20000 |
|
Images 01 through 07 in sequence |
Data Evalutation
Track 2, channel 31, shows some aircraft noise. Track 4, ports 3 and 4 show LN2 blowoffs (banding across flightline). This is particularly bad in port 4. Port 4 also shows dropped scanlines. Both problems only occur early in the flightline, remainder of flightline appears OK. Track 6 smeared at start of flightline.
Spectral Summary
Spectral Band Configuration
Spectral Response Files
Level-1B Data Distribution
NASA Goddard Space Flight Center DAAC
Related Web Sites
JPL AVIRIS Web Page
Airborne Sensors Facility Page
NASA ER-2 Aircraft Program
|
|