
|
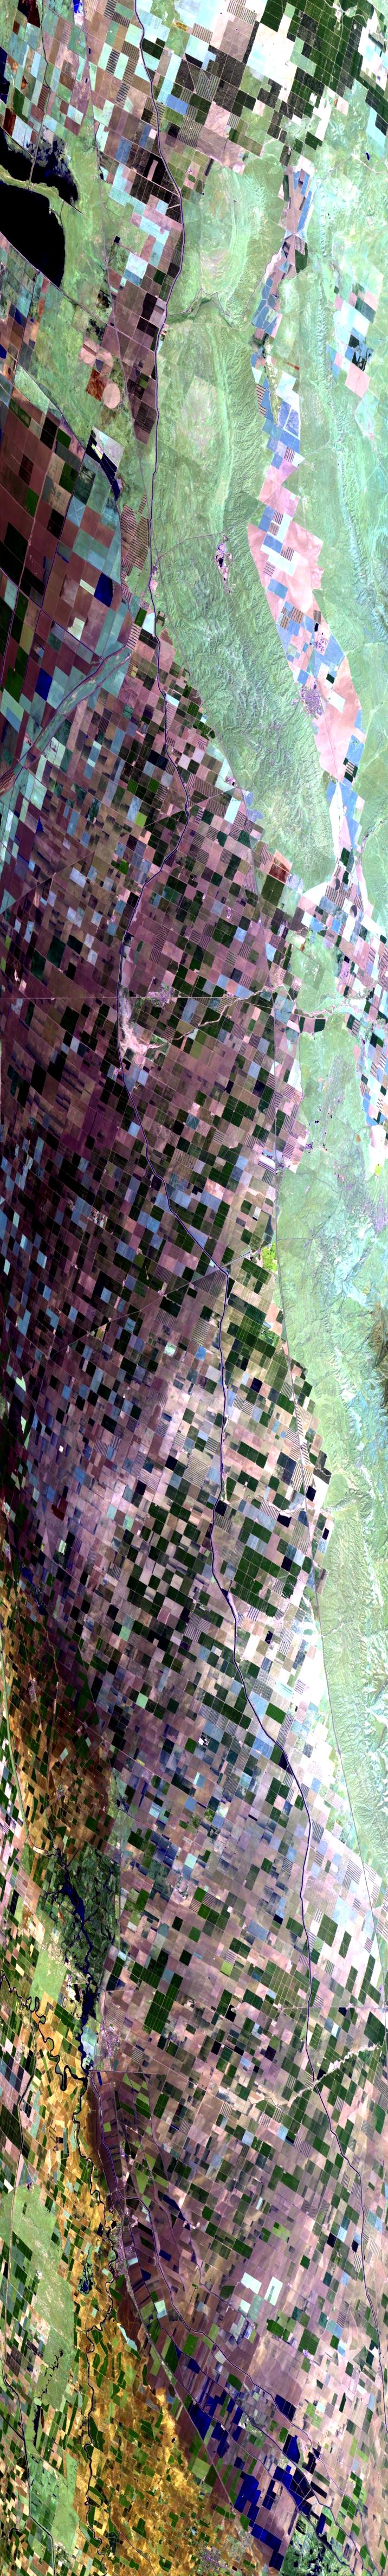
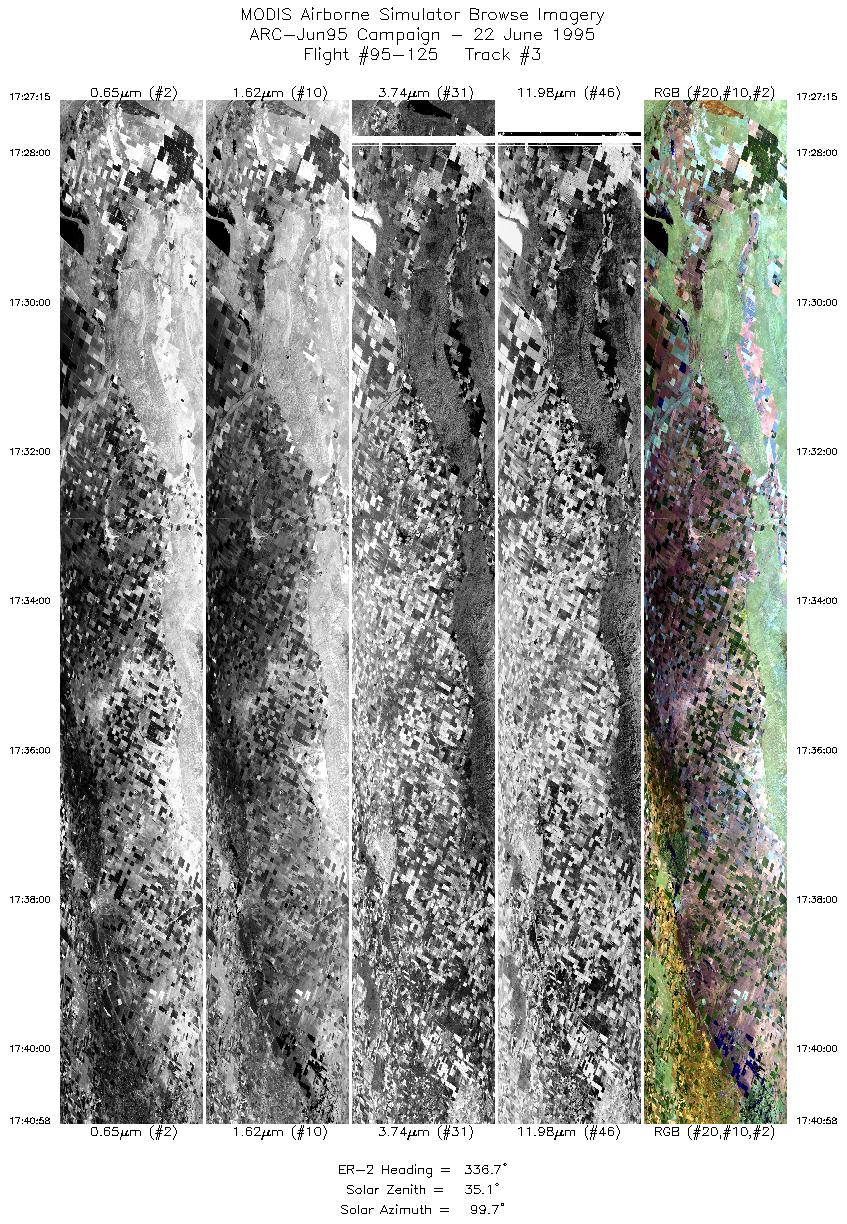
Sample Image

21 June 1995
Track #03
scanlines 250-5000 of 5120
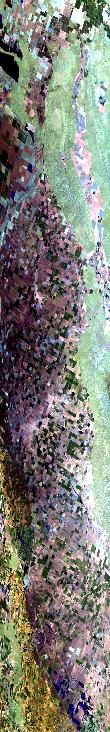
The flightline runs south to north through the San Joaquin Valley following the California Aqueduct and the Interstate 5 Freeway.
R: 2.14 microns
G: 1.62 microns
B: 0.55 microns
|
|
Mission Summary
Date: June 22, 1995
ER-2 Flight Number: 95-125
Deployment: ARC-Jun95
Flight Location: Crystal Lake, Lake Tahoe, Eldorado National Forest
Principal Investigators: Dr. Susan Ustin (UCD), Dr. Jeff Dozier (UCSB), Dr. Philip Slater (UofA)
Additional Sensors: 12" RC-10 (CIR), AVIRIS
Objective: Data used to better understand biospheric-atmospheric interactions (Ustin). Development and validation of algorithms describing the physical properties of snow and glacial ice, including spectral albedo, grainsize, impurities, depth, and wetness (Dozier). AVIRIS data used in refining calibration techniques and data validation (Slater).
Level-1B Processing Information
Level-1B Data processed by: Ames Research Center
Level-1B Data Version: #09
Level-1B Configuration: (sample file)
Calibration Type: Final
Calibration Version: 1.0
Temperature Adjustment: 35C
Status: Completed with final calibration
|
|
Flight Track Map

|
Level-1B Browse Imagery
Straight Line Flight Tracks: 11
Scanlines Processed: 35301
Solar Azimuth and Zenith Angles
|
Browse Images
|
Click on the Flight Track number to load images.
Lat/Lon ranges are for the BEG-END scanline nadir pixels.
|
Flight
Track |
Time_Span
(GMT) |
Heading
(Deg) |
Lat_Range
(Deg_N) |
Lon_Range
(Deg_W) |
Length
(Scanlines) |
Altitude
(Meters) |
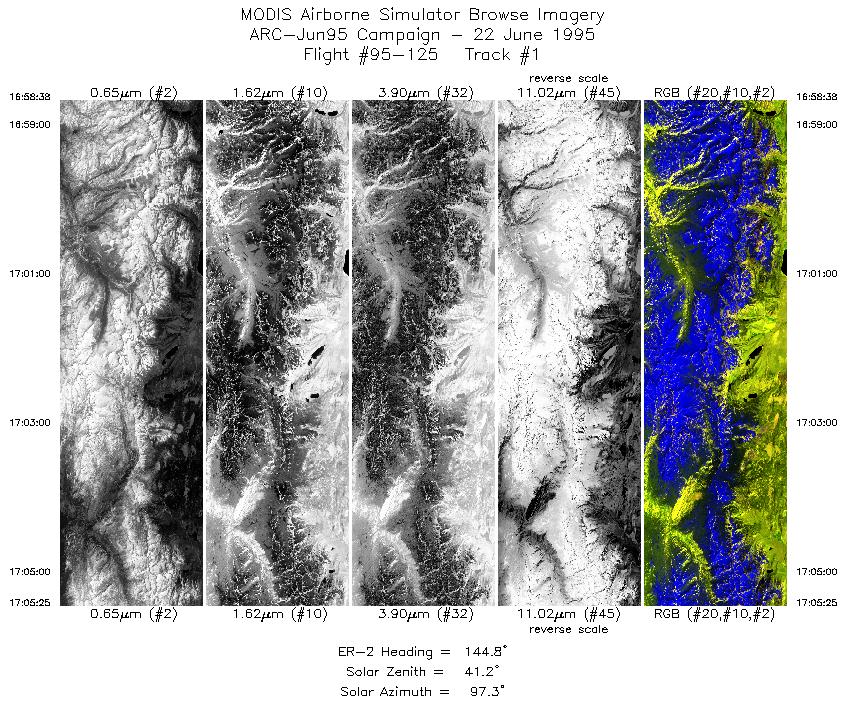
| 1 |
16:58-17:05 |
145 |
38.13-37.49 |
119.44-118.92 |
2531 |
~20000 |
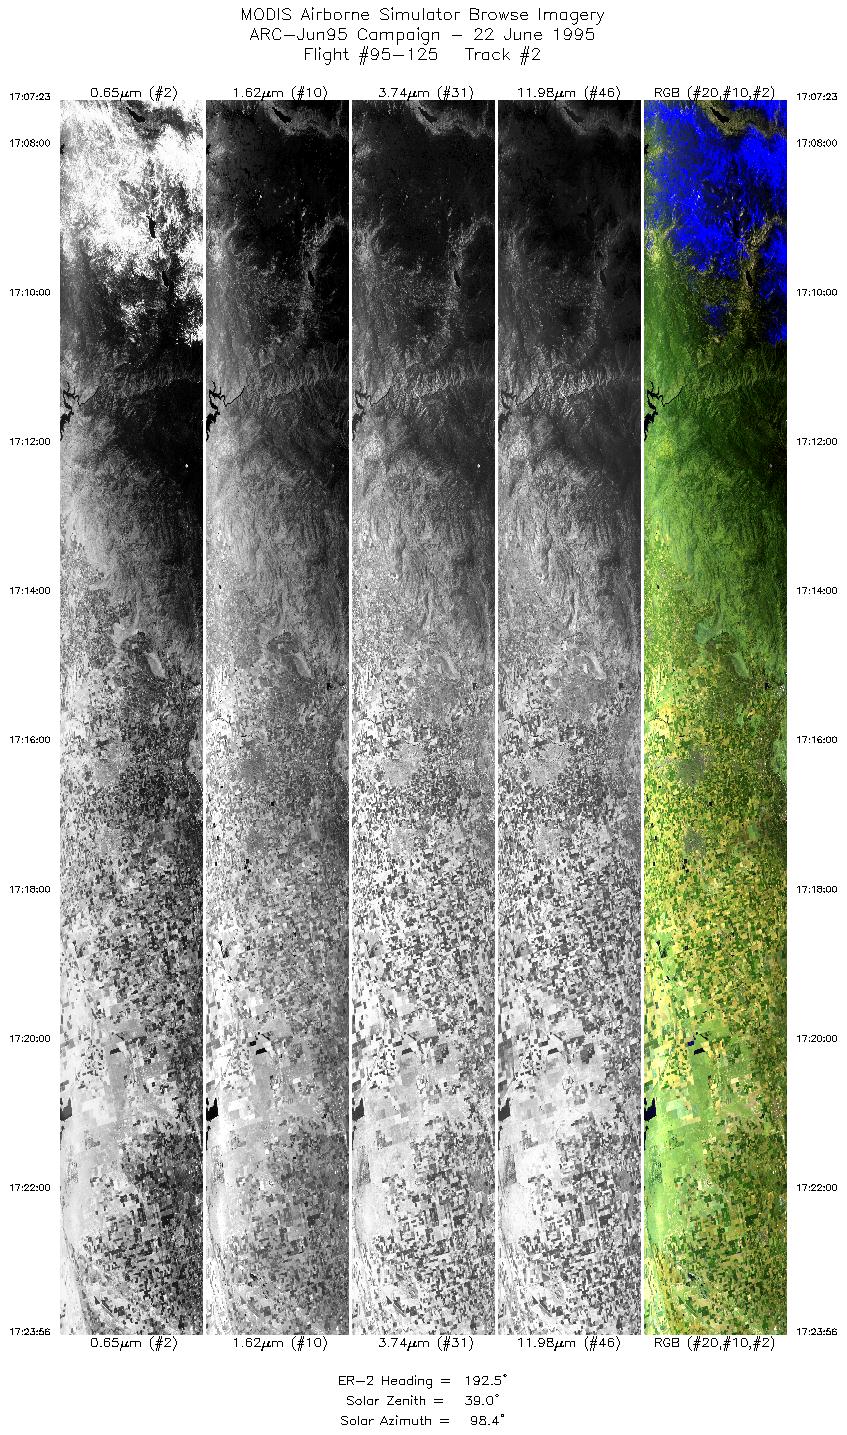
| 2 |
17:07-17:23 |
193 |
37.29-35.47 |
118.95-119.50 |
6178 |
~20000 |
| 3 |
17:27-17:40 |
337 |
35.61-37.03 |
119.78-120.65 |
5120 |
~20000 |
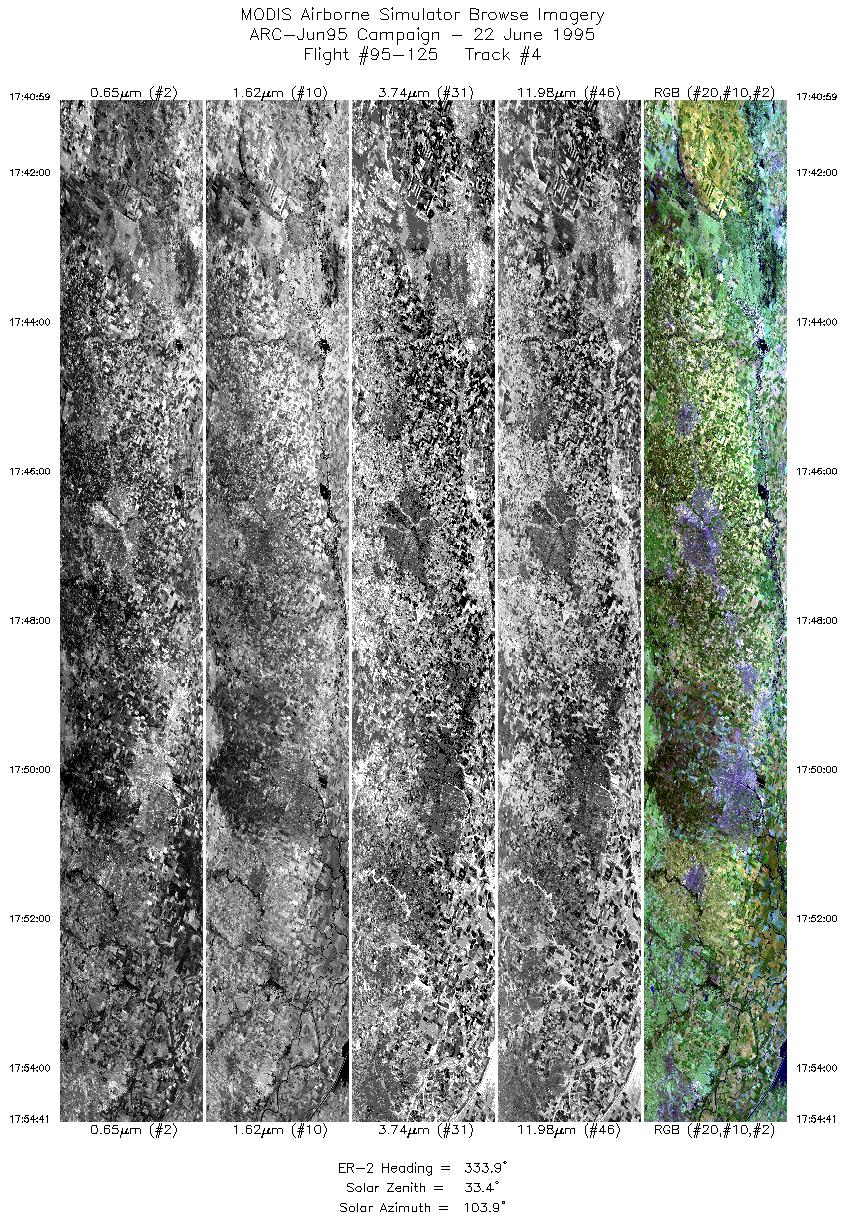
| 4 |
17:40-17:54 |
334 |
37.03-38.44 |
120.65-121.55 |
5114 |
~20000 |
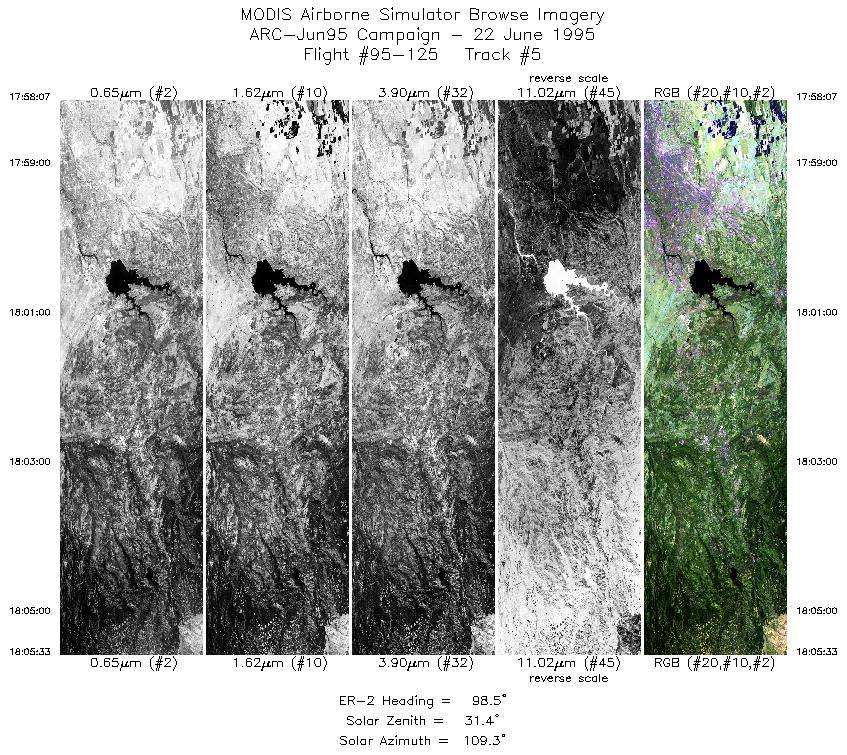
| 5 |
17:58-18:05 |
99 |
38.80-38.68 |
121.47-120.41 |
2775 |
~20000 |
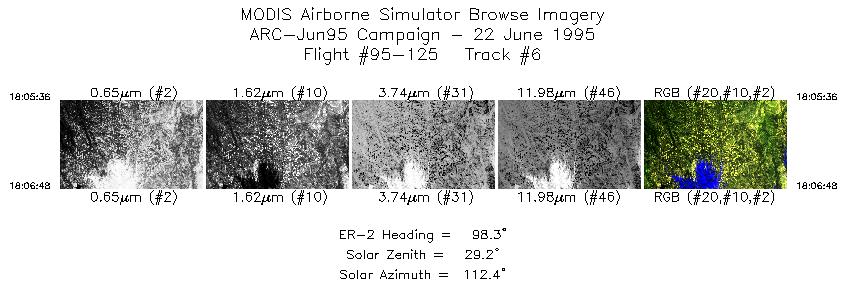
| 6 |
18:05-18:06 |
98 |
38.68-38.66 |
120.40-120.23 |
449 |
~20000 |
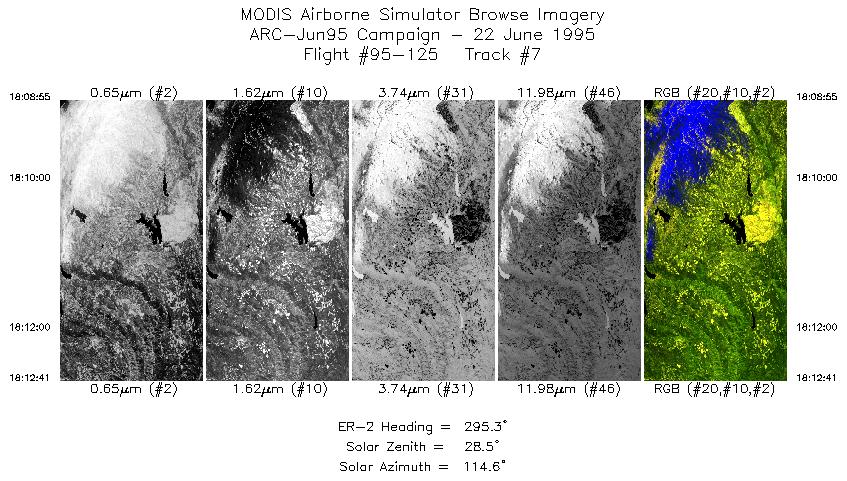
| 7 |
18:08-18:12 |
295 |
38.83-38.99 |
120.17-120.66 |
1407 |
~20000 |
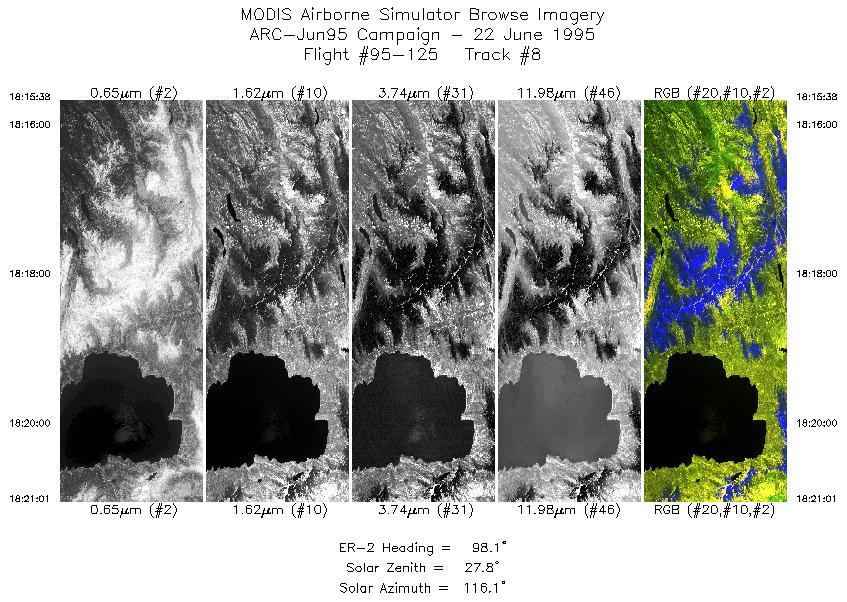
| 8 |
18:15-18:21 |
98 |
39.24-39.14 |
120.63-119.86 |
2010 |
~20000 |
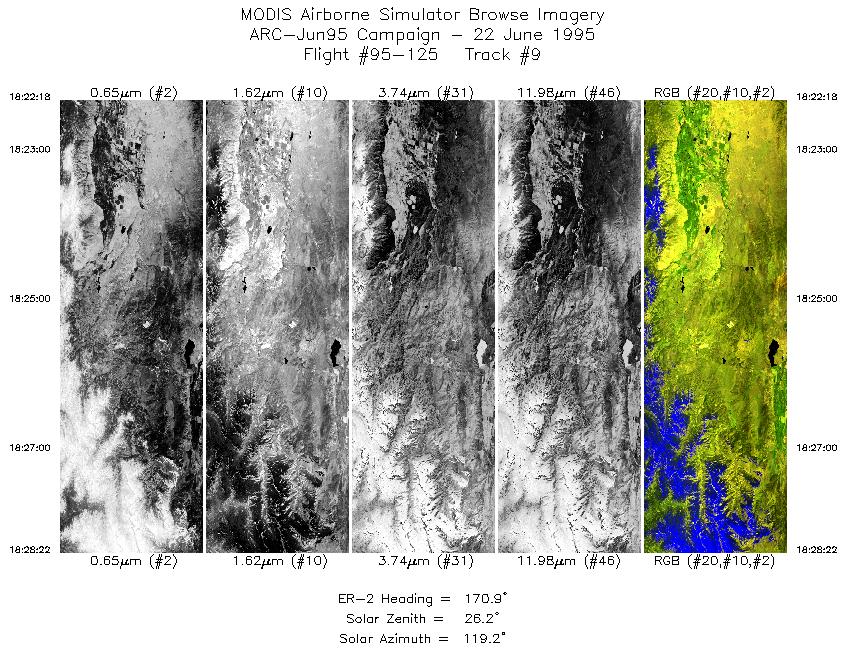
| 9 |
18:22-18:28 |
171 |
39.04-38.36 |
119.74-119.62 |
2265 |
~20000 |
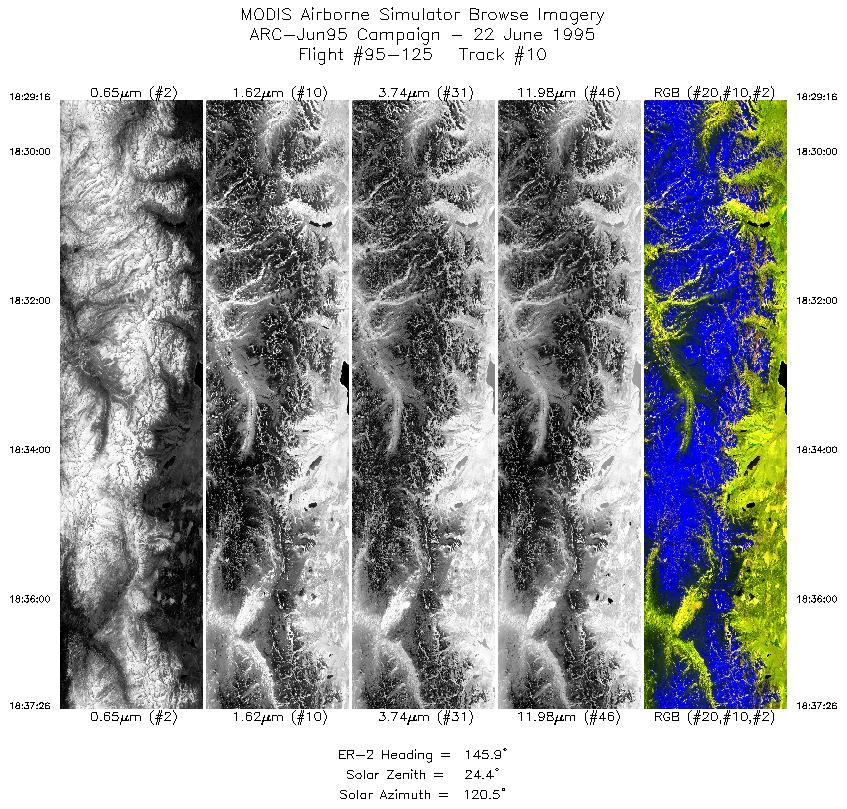
| 10 |
18:29-18:37 |
146 |
38.27-37.50 |
119.56-118.92 |
3048 |
~20000 |
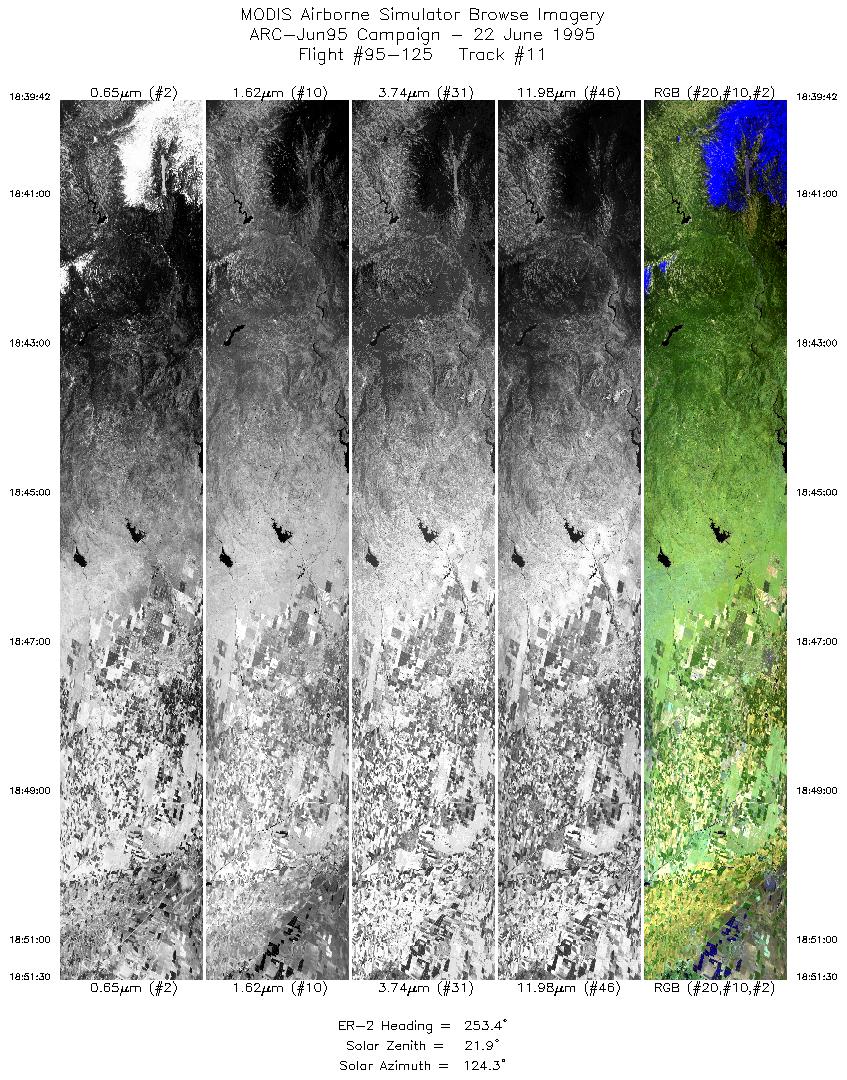
| 11 |
18:39-18:51 |
253 |
37.33-36.91 |
119.08-120.69 |
4404 |
~20000 |
|
Images 01 through 11 in sequence |
Data Evalutation
Some bad scanlines in port 4 (channels 43-50), otherwise
excellent data quality.
Spectral Summary
Spectral Band Configuration
Spectral Response Files
Level-1B Data Distribution
NASA Goddard Space Flight Center DAAC
Related Web Sites
JPL AVIRIS Web Page
Airborne Sensors Facility Page
NASA ER-2 Aircraft Program
|
|