
|
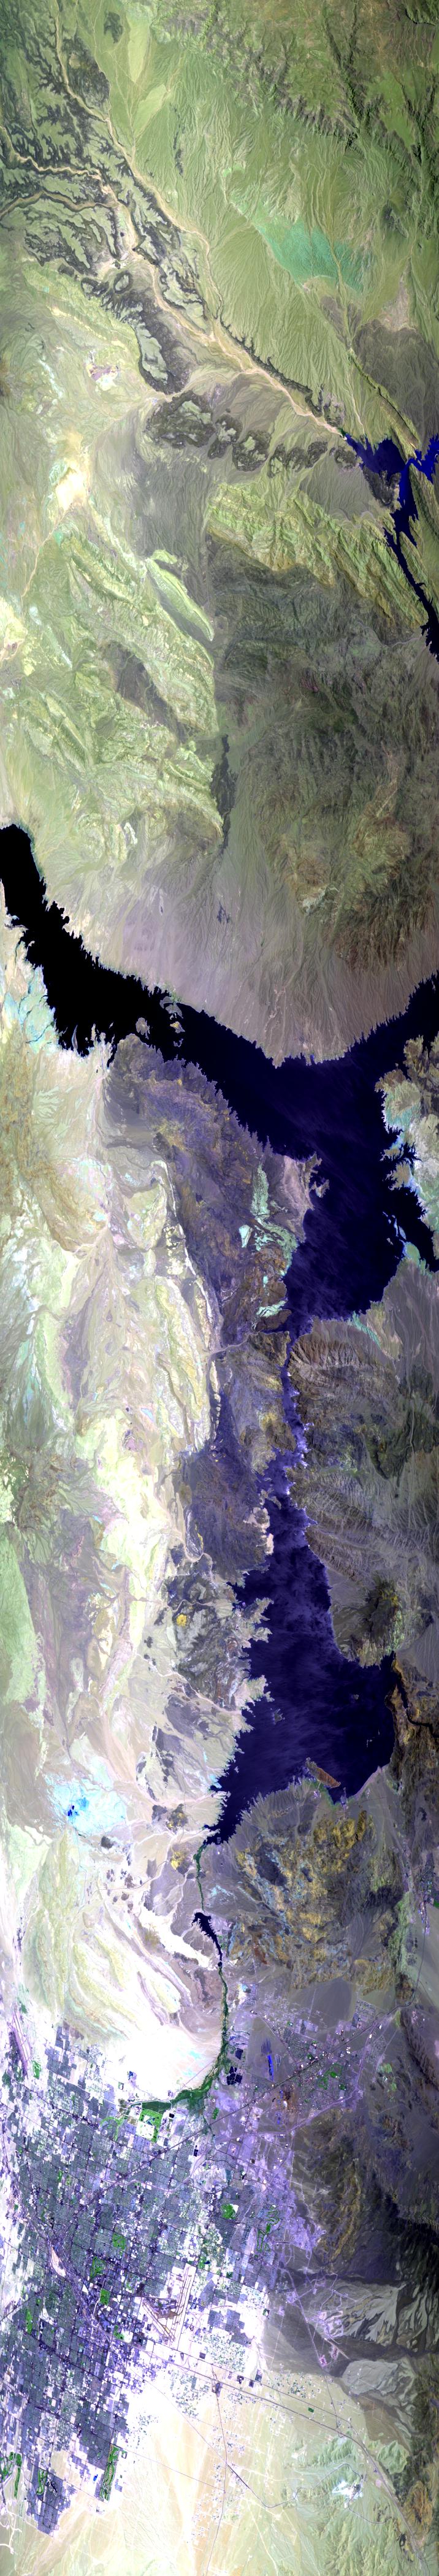
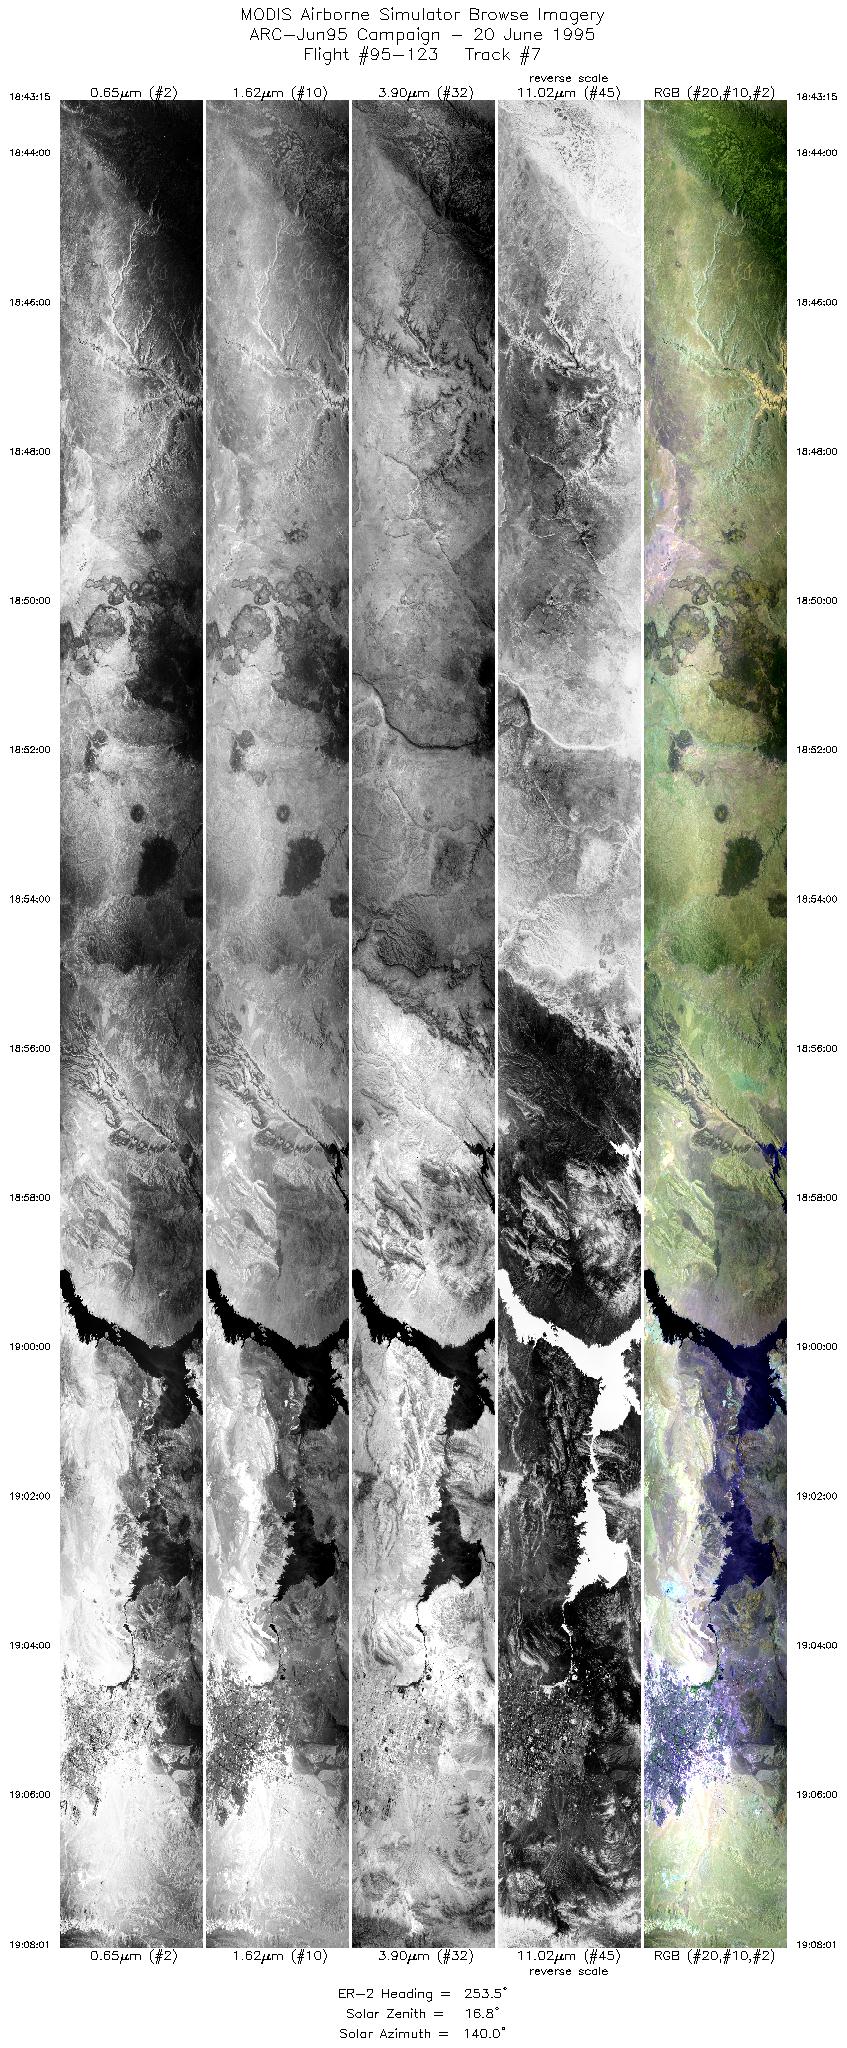
Sample Image

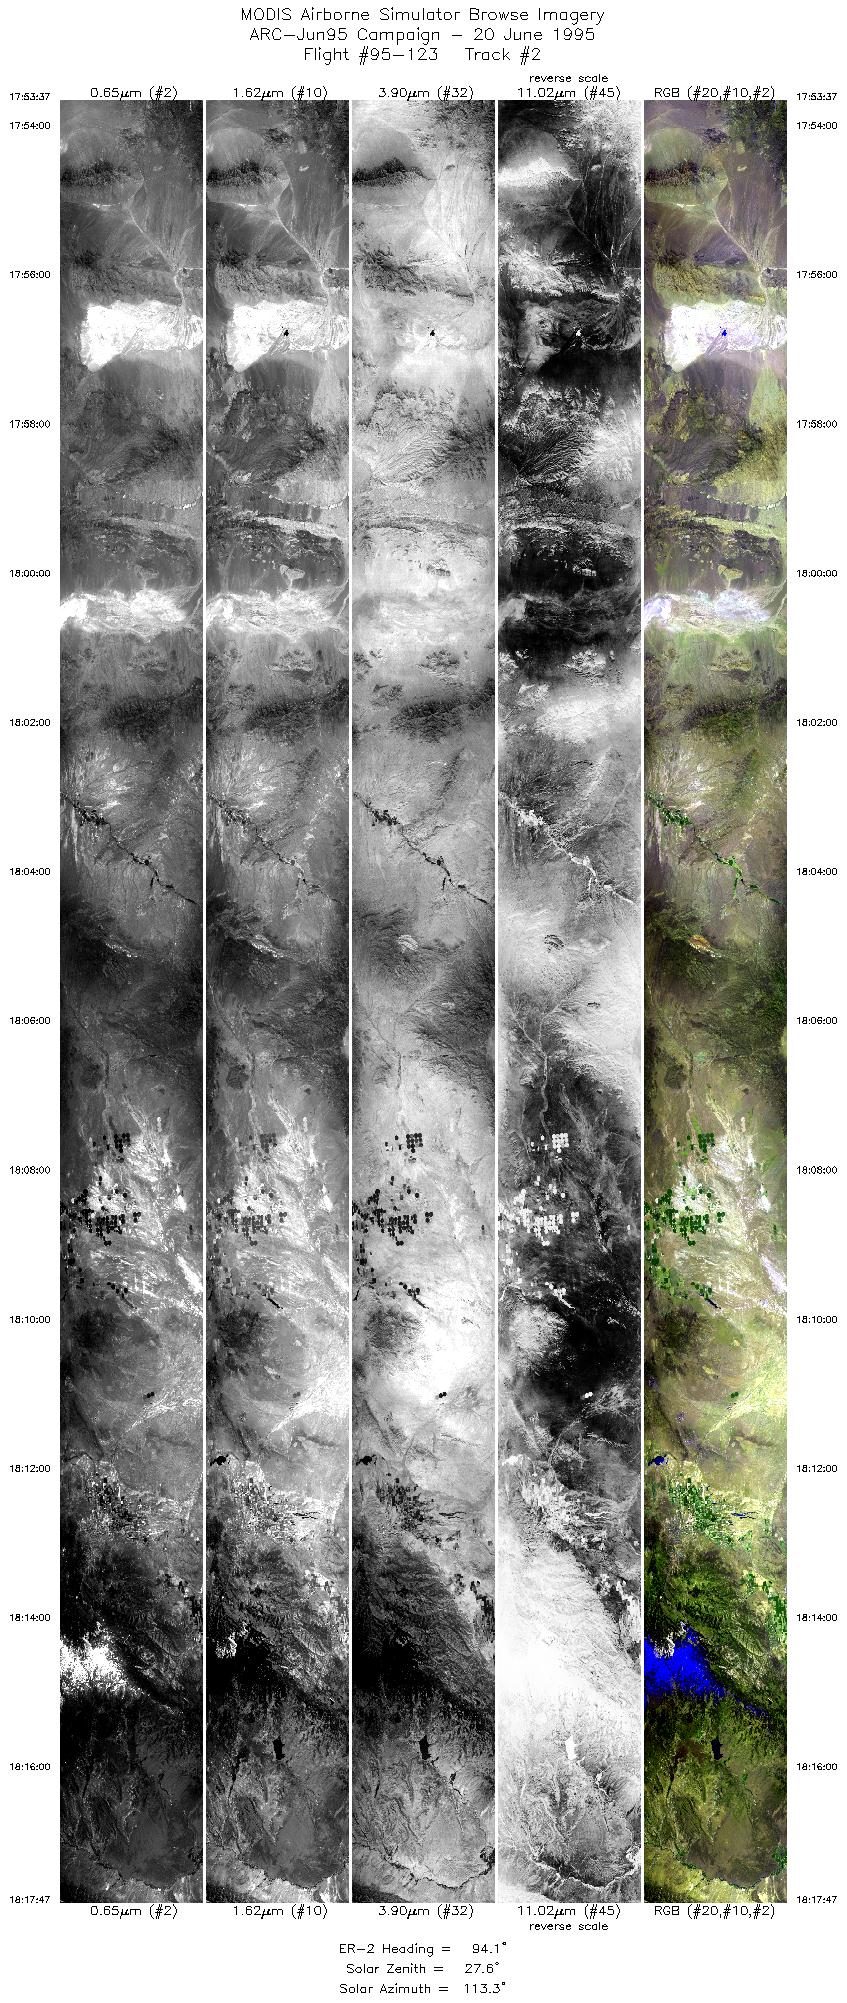
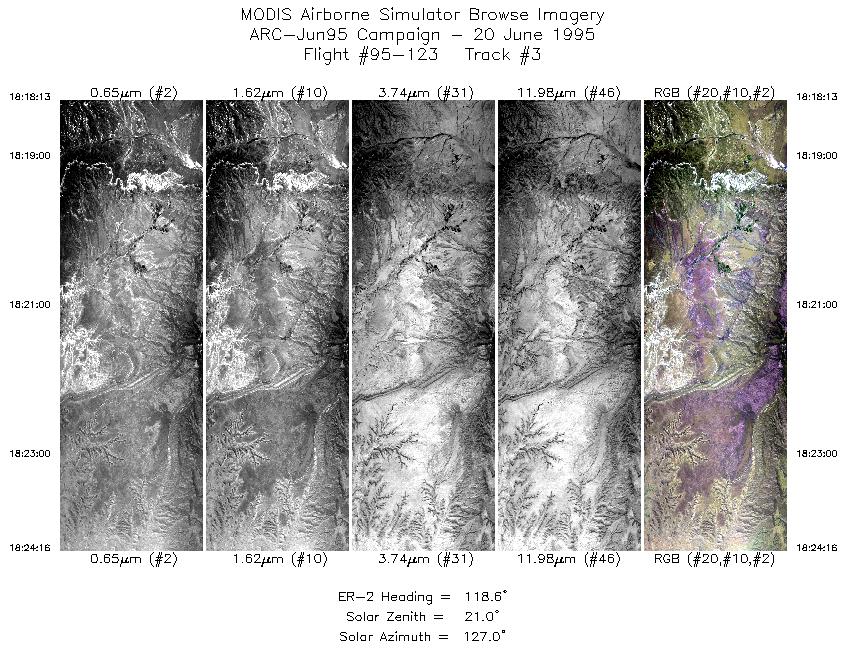
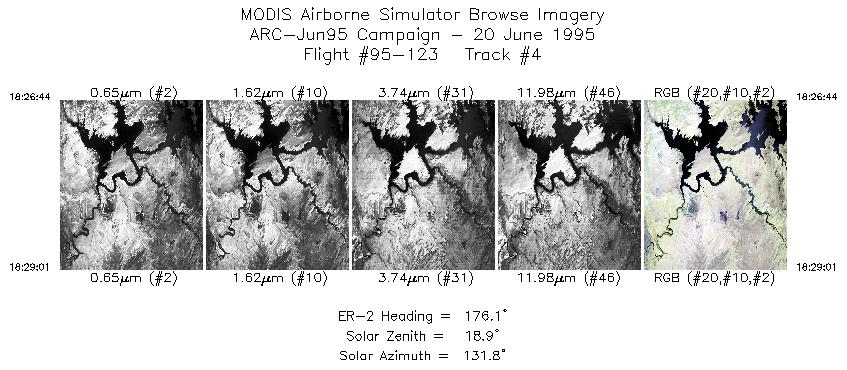
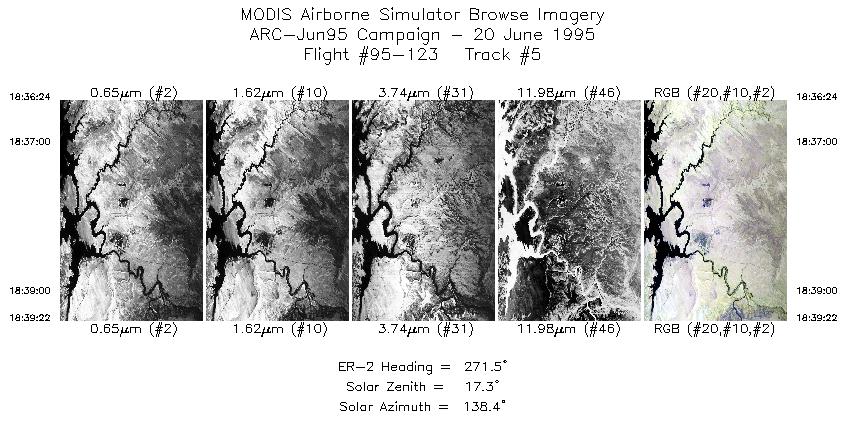
20 June 1995
Track #07
Scanlines 4500-8700 of 9240


Flightline moving west across the Lake Mead National Recreation Area, ending over Las Vegas, Nevada.
R: 2.14 microns
G: 1.62 microns
B: 0.55 microns
|
|
Mission Summary
Date: June 20, 1995
ER-2 Flight Number: 95-123
Deployment: ARC-Jun95
Flight Location: Mountain Pass, Ivanpah, California
Principal Investigator: Dr. Robert Green (JPL)
Additional Sensors: 12" RC-10 (CIR), AVIRIS
Objective: Data used to validate and calibrate the AVIRIS instrument for eventual comparison to data collected by the HSI sensor onboard the Lewis satellite.
Level-1B Processing Information
Level-1B Data processed by: Ames Research Center
Level-1B Data Version: #09
Level-1B Configuration: (sample file)
Calibration Type: Final
Calibration Version: 1.0
Temperature Adjustment: 35C
Status: Completed with final calibration
|
|
Flight Track Map

|
Level-1B Browse Imagery
Straight Line Flight Tracks: 24
Scanlines Processed: 66671
Solar Azimuth and Zenith Angles
|
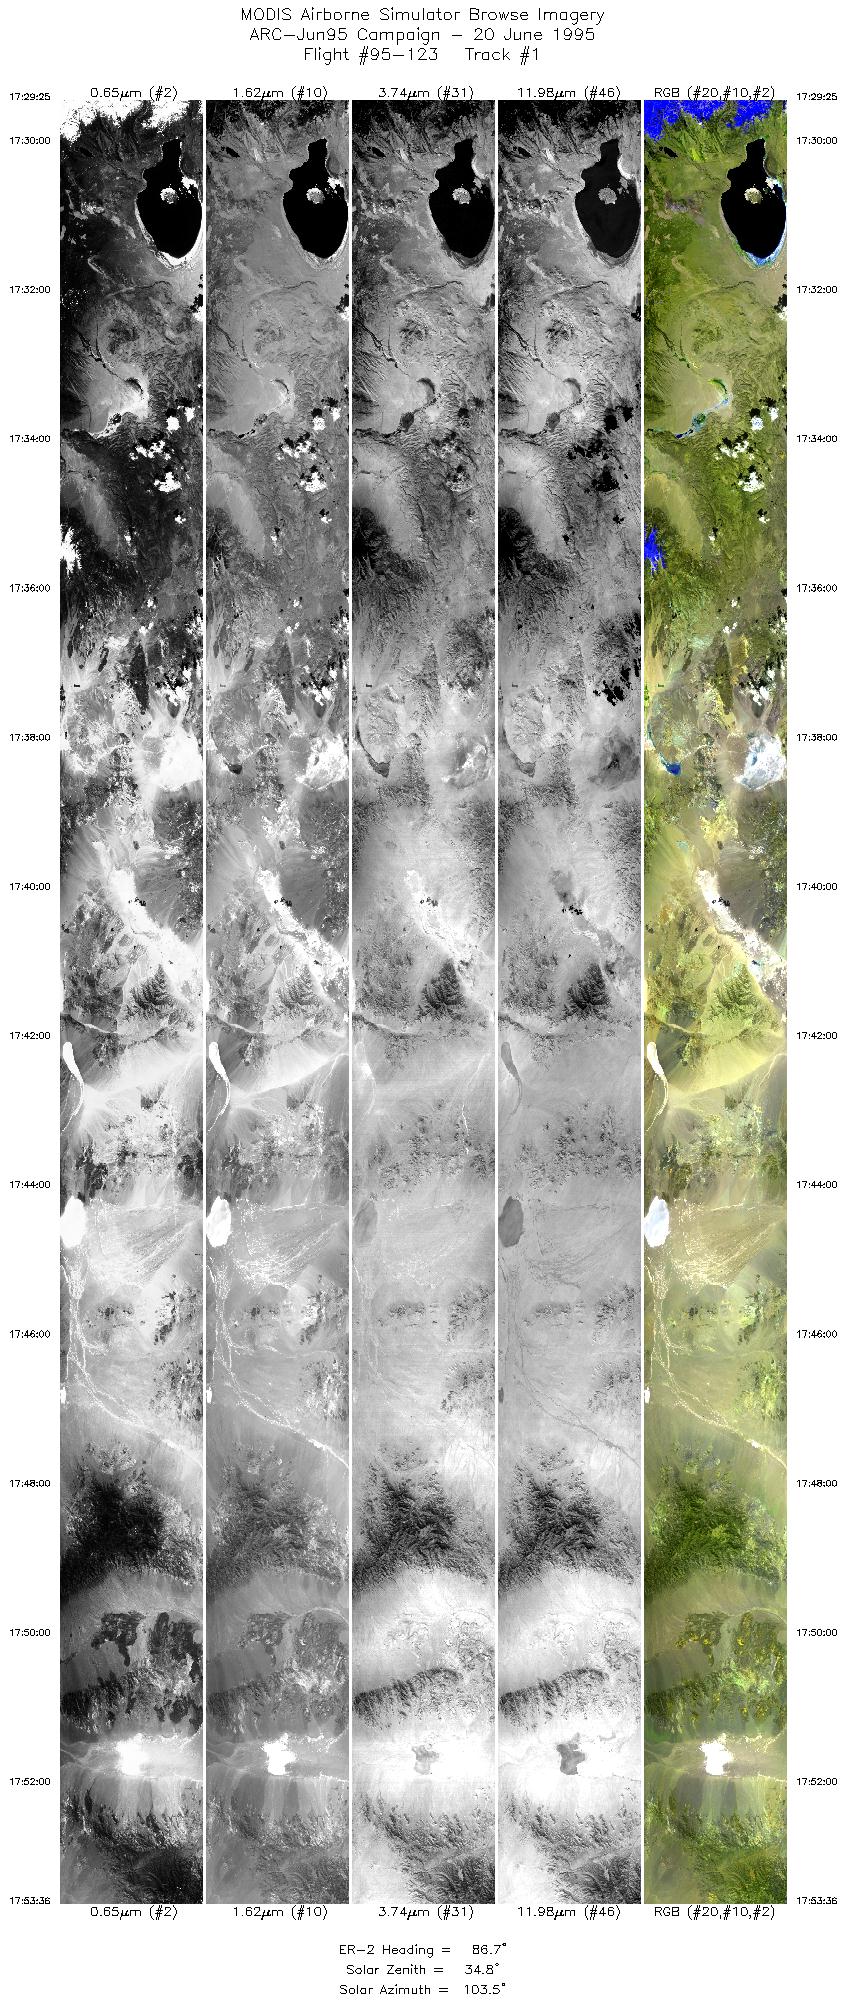
Browse Images
|
Click on the Flight Track number to load images.
Lat/Lon ranges are for the BEG-END scanline nadir pixels.
|
Flight
Track |
Time_Span
(GMT) |
Heading
(Deg) |
Lat_Range
(Deg_N) |
Lon_Range
(Deg_W) |
Length
(Scanlines) |
Altitude
(Meters) |
| 1 |
17:29-17:53 |
87 |
37.96-38.02 |
119.23-115.75 |
9023 |
~20000 |
| 2 |
17:53-18:17 |
94 |
37.99-37.70 |
115.74-112.36 |
9019 |
~20000 |
| 3 |
18:18-18:24 |
119 |
37.68-37.34 |
112.29-111.54 |
2258 |
~20000 |
| 4 |
18:26-18:29 |
176 |
37.09-36.82 |
111.40-111.39 |
853 |
~20000 |
| 5 |
18:36-18:39 |
271 |
36.88-36.89 |
111.19-111.61 |
1108 |
~20000 |
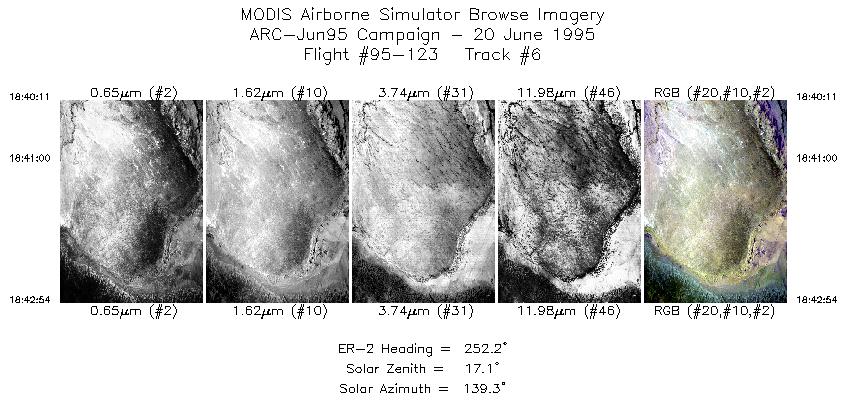
| 6 |
18:40-18:42 |
252 |
36.88-36.78 |
111.73-112.10 |
1015 |
~20000 |
| 7 |
18:43-19:08 |
253 |
36.77-35.96 |
112.14-115.49 |
9240 |
~20000 |
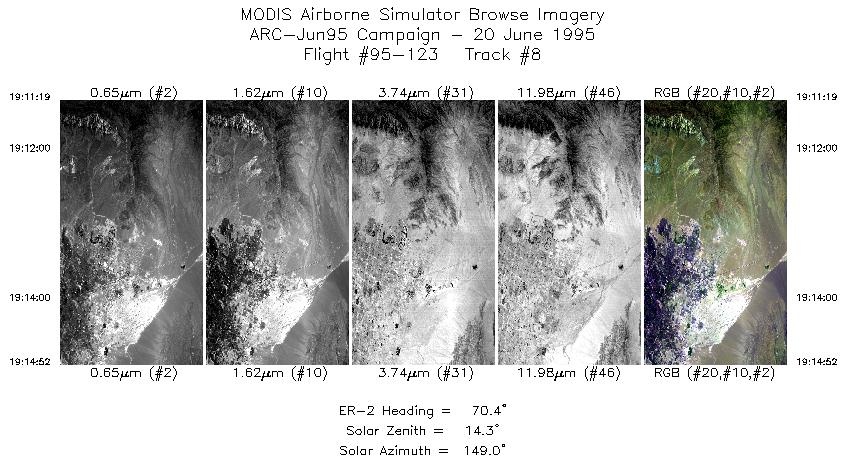
| 8 |
19:11-19:14 |
70 |
36.18-36.32 |
115.58-115.11 |
1326 |
~20000 |
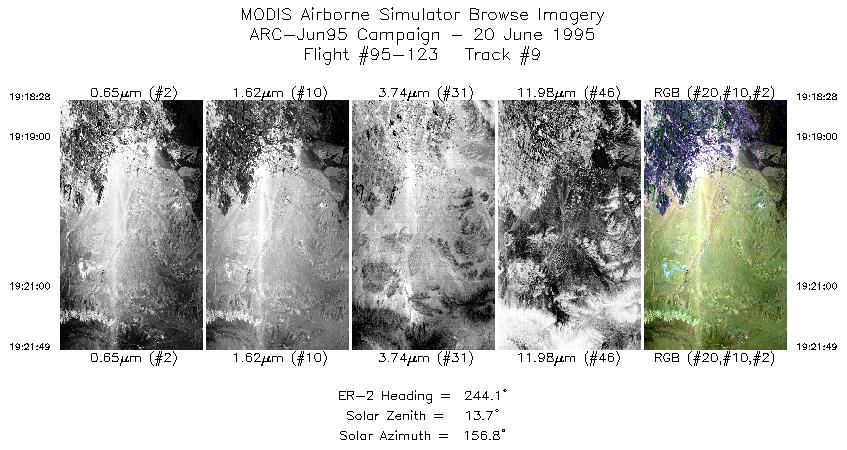
| 9 |
19:18-19:21 |
244 |
36.08-35.95 |
115.06-115.50 |
1251 |
~20000 |
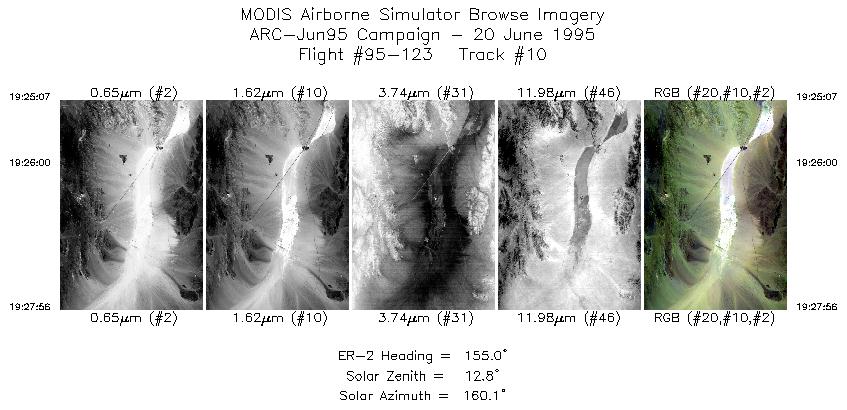
| 10 |
19:25-19:27 |
155 |
35.66-35.37 |
115.47-115.32 |
1052 |
~20000 |
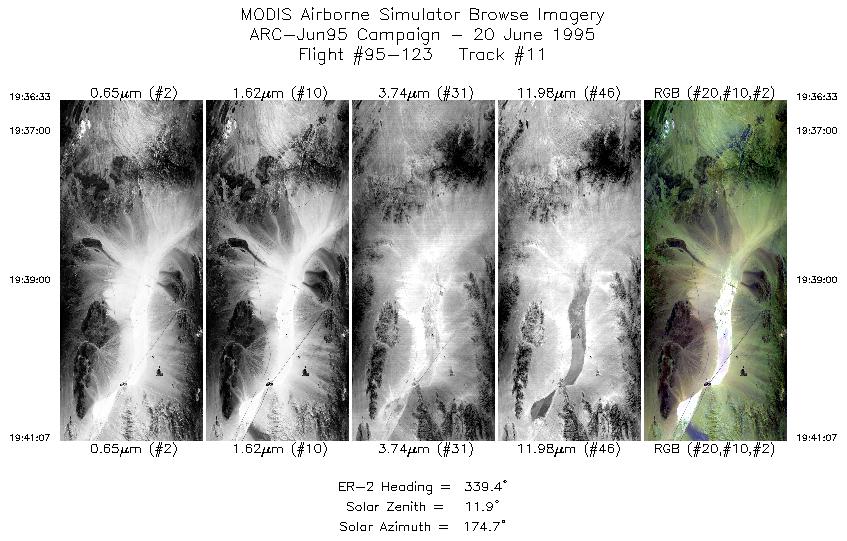
| 11 |
19:36-19:41 |
339 |
35.20-35.68 |
115.20-115.45 |
1705 |
~20000 |
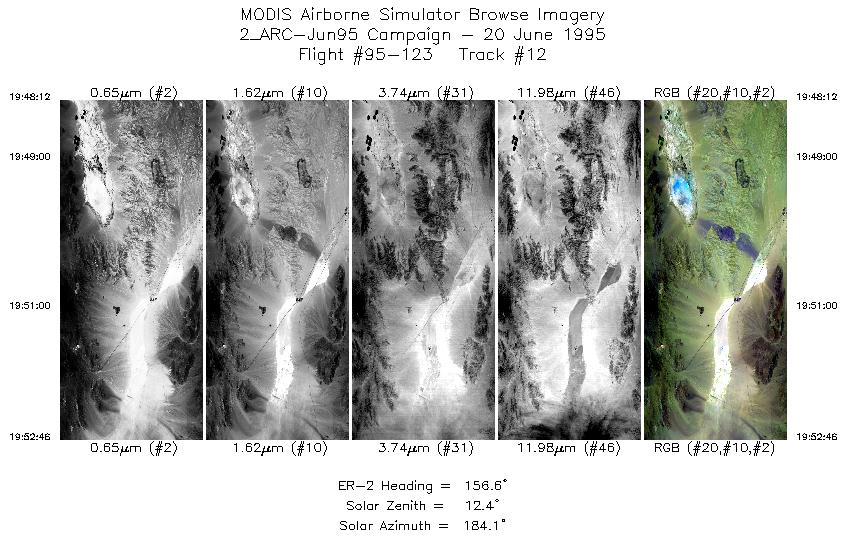
| 12 |
19:48-19:52 |
157 |
35.88-35.40 |
115.57-115.32 |
1703 |
~20000 |
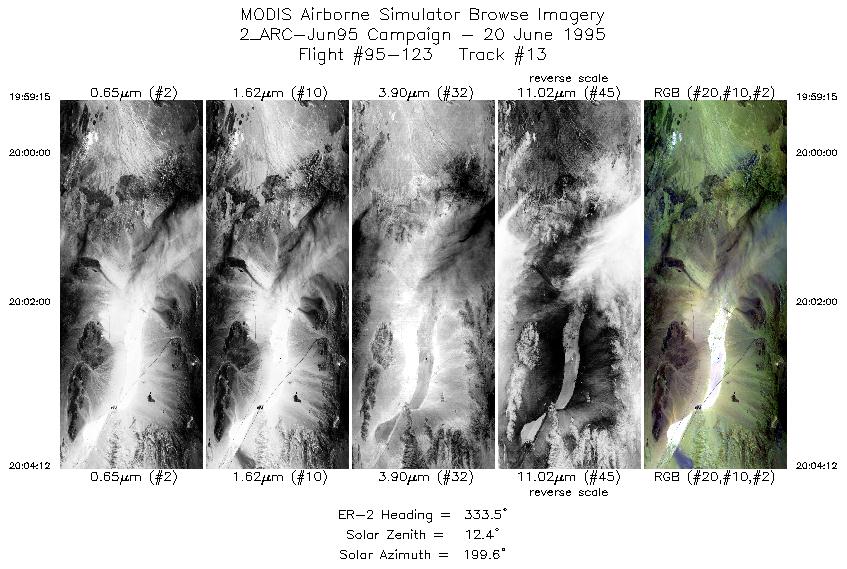
| 13 |
19:59-20:04 |
333 |
35.18-35.67 |
115.17-115.48 |
1848 |
~20000 |
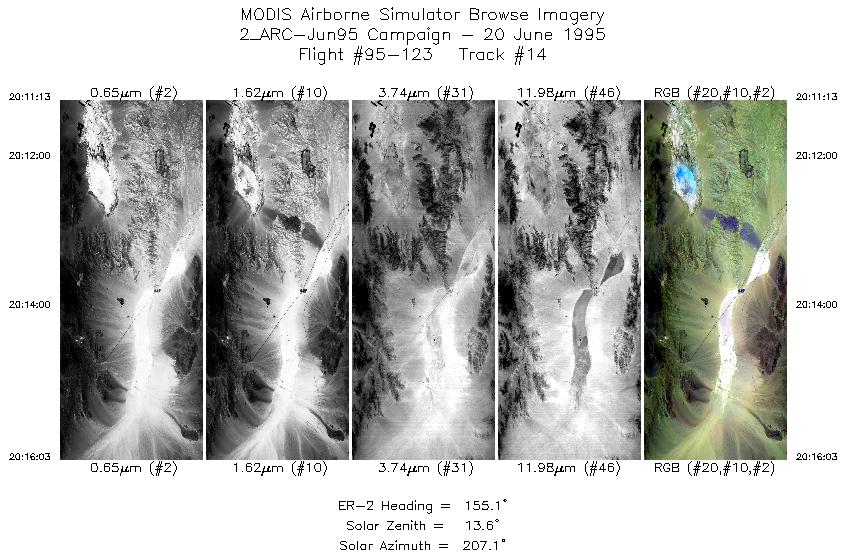
| 14 |
20:11-20:16 |
155 |
35.87-35.36 |
115.57-115.32 |
1804 |
~20000 |
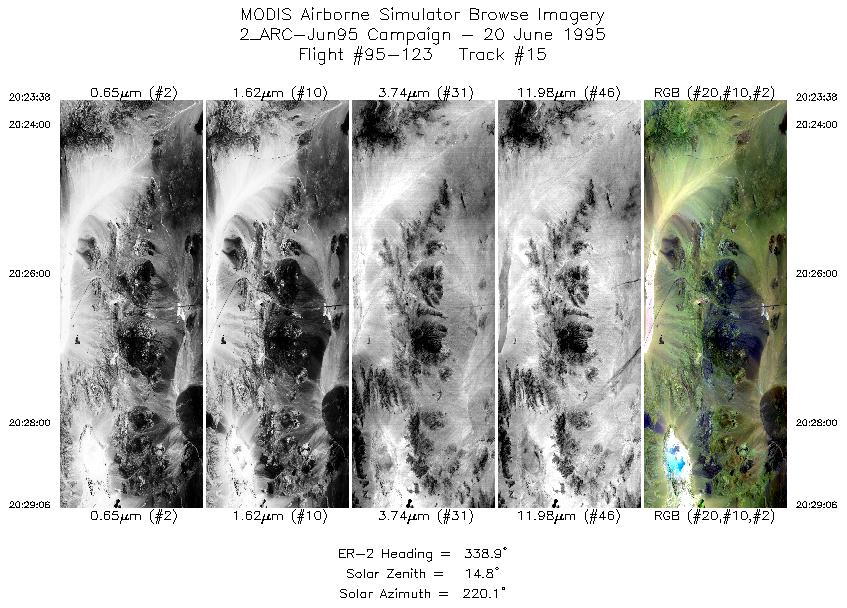
| 15 |
20:23-20:29 |
339 |
35.19-35.76 |
115.42-115.72 |
2041 |
~20000 |
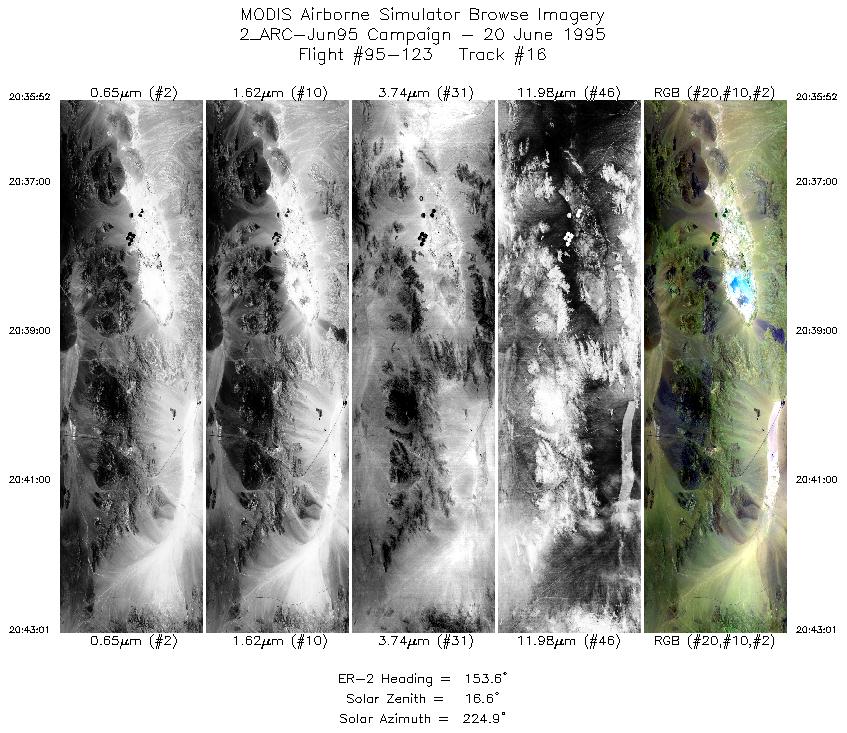
| 16 |
20:35-20:43 |
154 |
35.97-35.24 |
115.77-115.38 |
2669 |
~20000 |
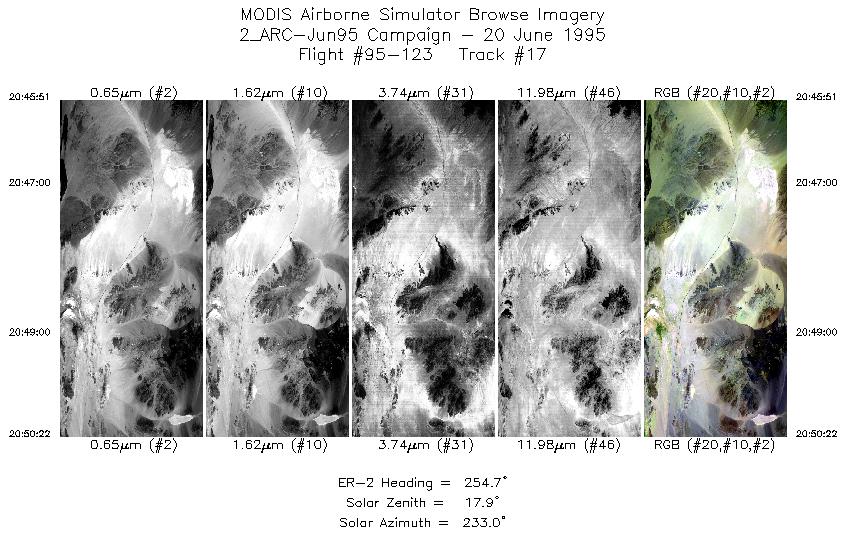
| 17 |
20:45-20:50 |
255 |
35.03-34.93 |
115.60-116.24 |
1687 |
~20000 |
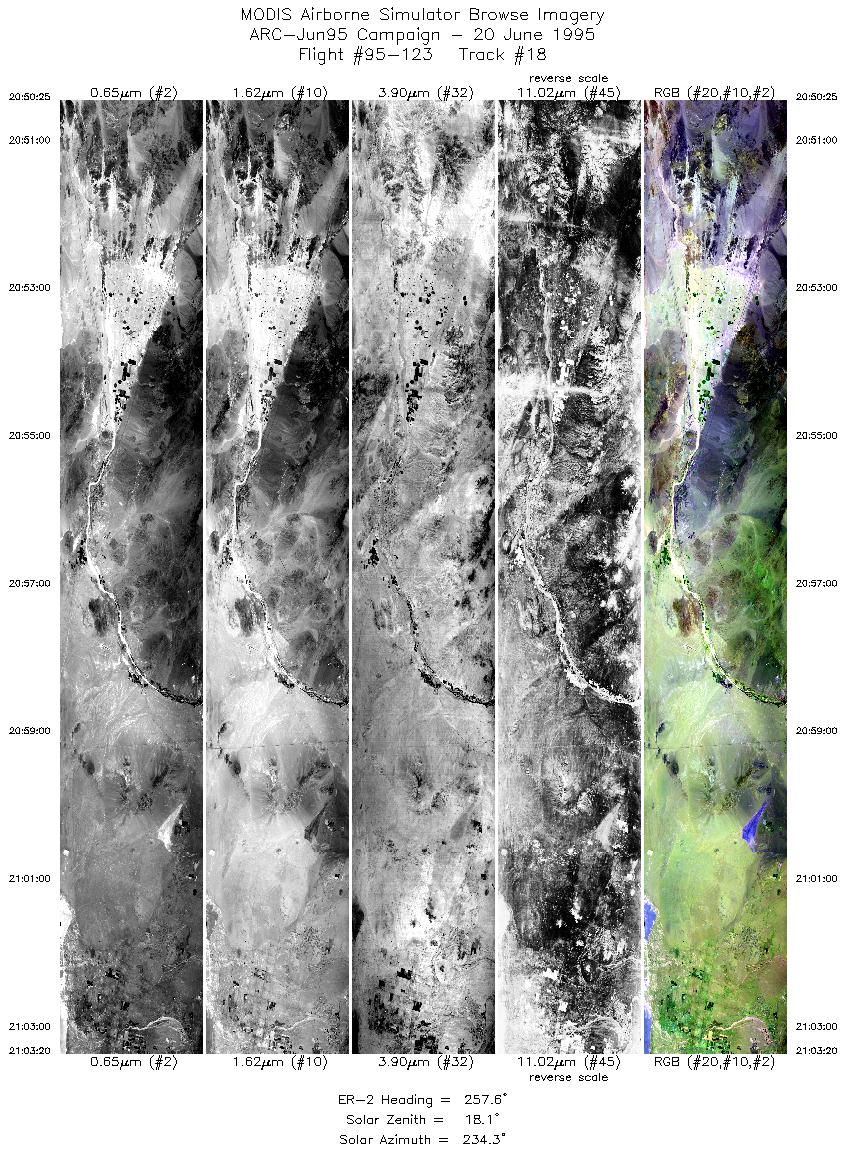
| 18 |
20:50-21:03 |
258 |
34.93-34.64 |
116.25-118.06 |
4773 |
~20000 |
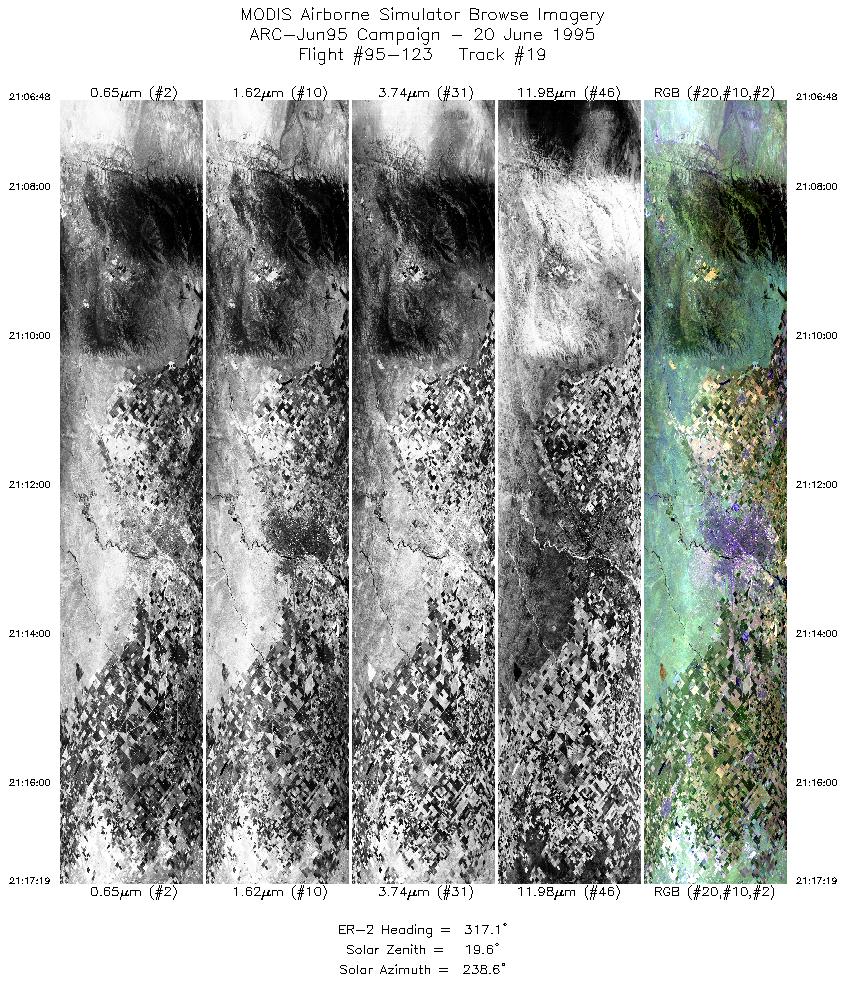
| 19 |
21:06-21:17 |
317 |
34.90-35.78 |
118.38-119.45 |
3923 |
~20000 |
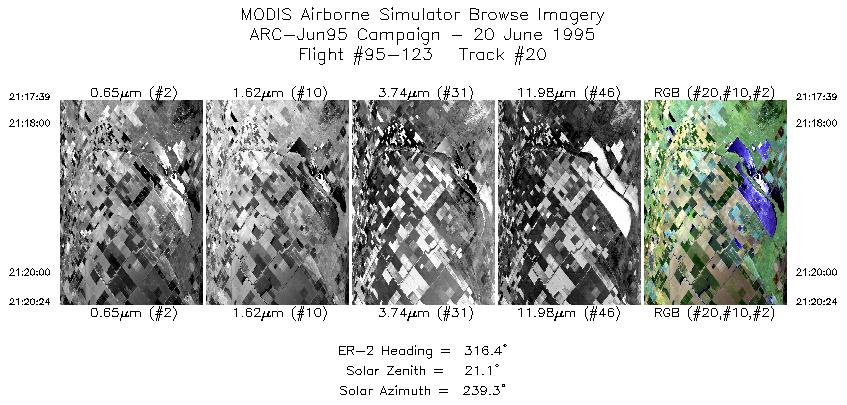
| 20 |
21:17-21:20 |
316 |
35.80-36.03 |
119.49-119.78 |
1026 |
~20000 |
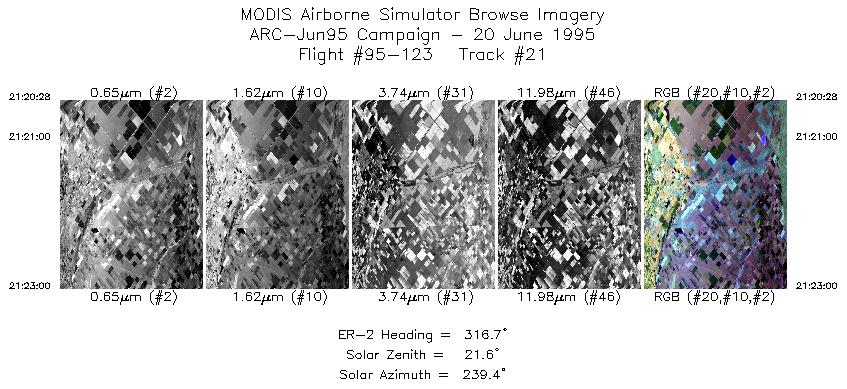
| 21 |
21:20-21:23 |
317 |
36.03-36.25 |
119.78-120.04 |
947 |
~20000 |
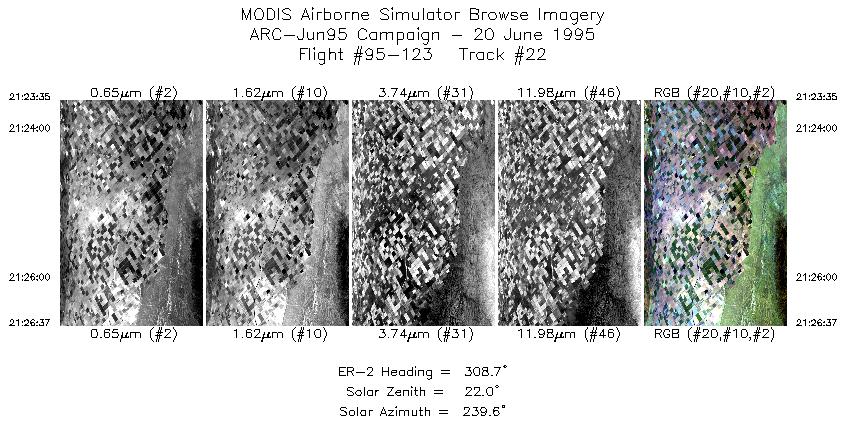
| 22 |
21:23-21:26 |
309 |
36.29-36.51 |
120.10-120.46 |
1132 |
~20000 |
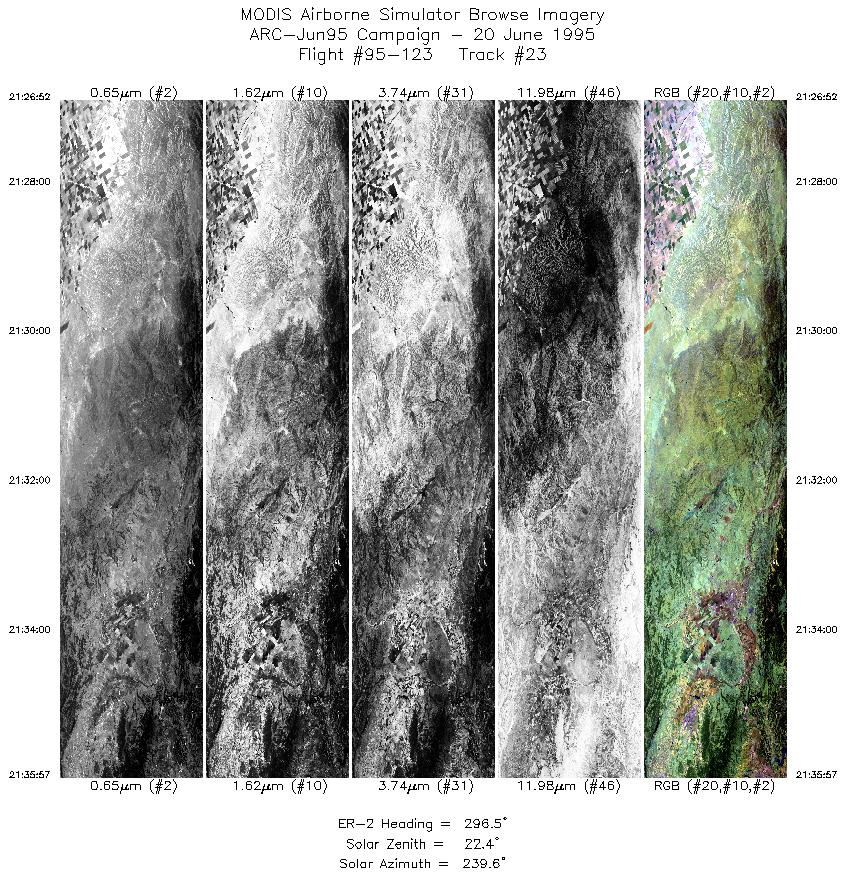
| 23 |
21:26-21:35 |
296 |
36.53-36.99 |
120.49-121.71 |
3390 |
~20000 |
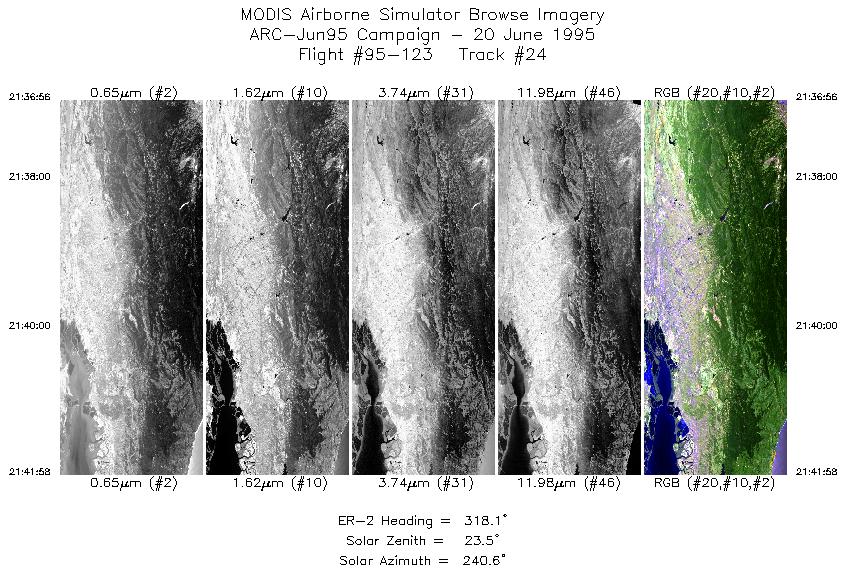
| 24 |
21:36-21:41 |
318 |
37.06-37.50 |
121.82-122.33 |
1878 |
~20000 |
|
Images 01 through 24 in sequence |
Data Evalutation
Data quality is excellent.
Spectral Summary
Spectral Band Configuration
Spectral Response Files
Level-1B Data Distribution
NASA Goddard Space Flight Center DAAC
Related Web Sites
JPL AVIRIS Web Page
Airborne Sensors Facility Page
NASA ER-2 Aircraft Program
|
|