


FLIGHT SUMMARY INFORMATION
Flight Track Map


|
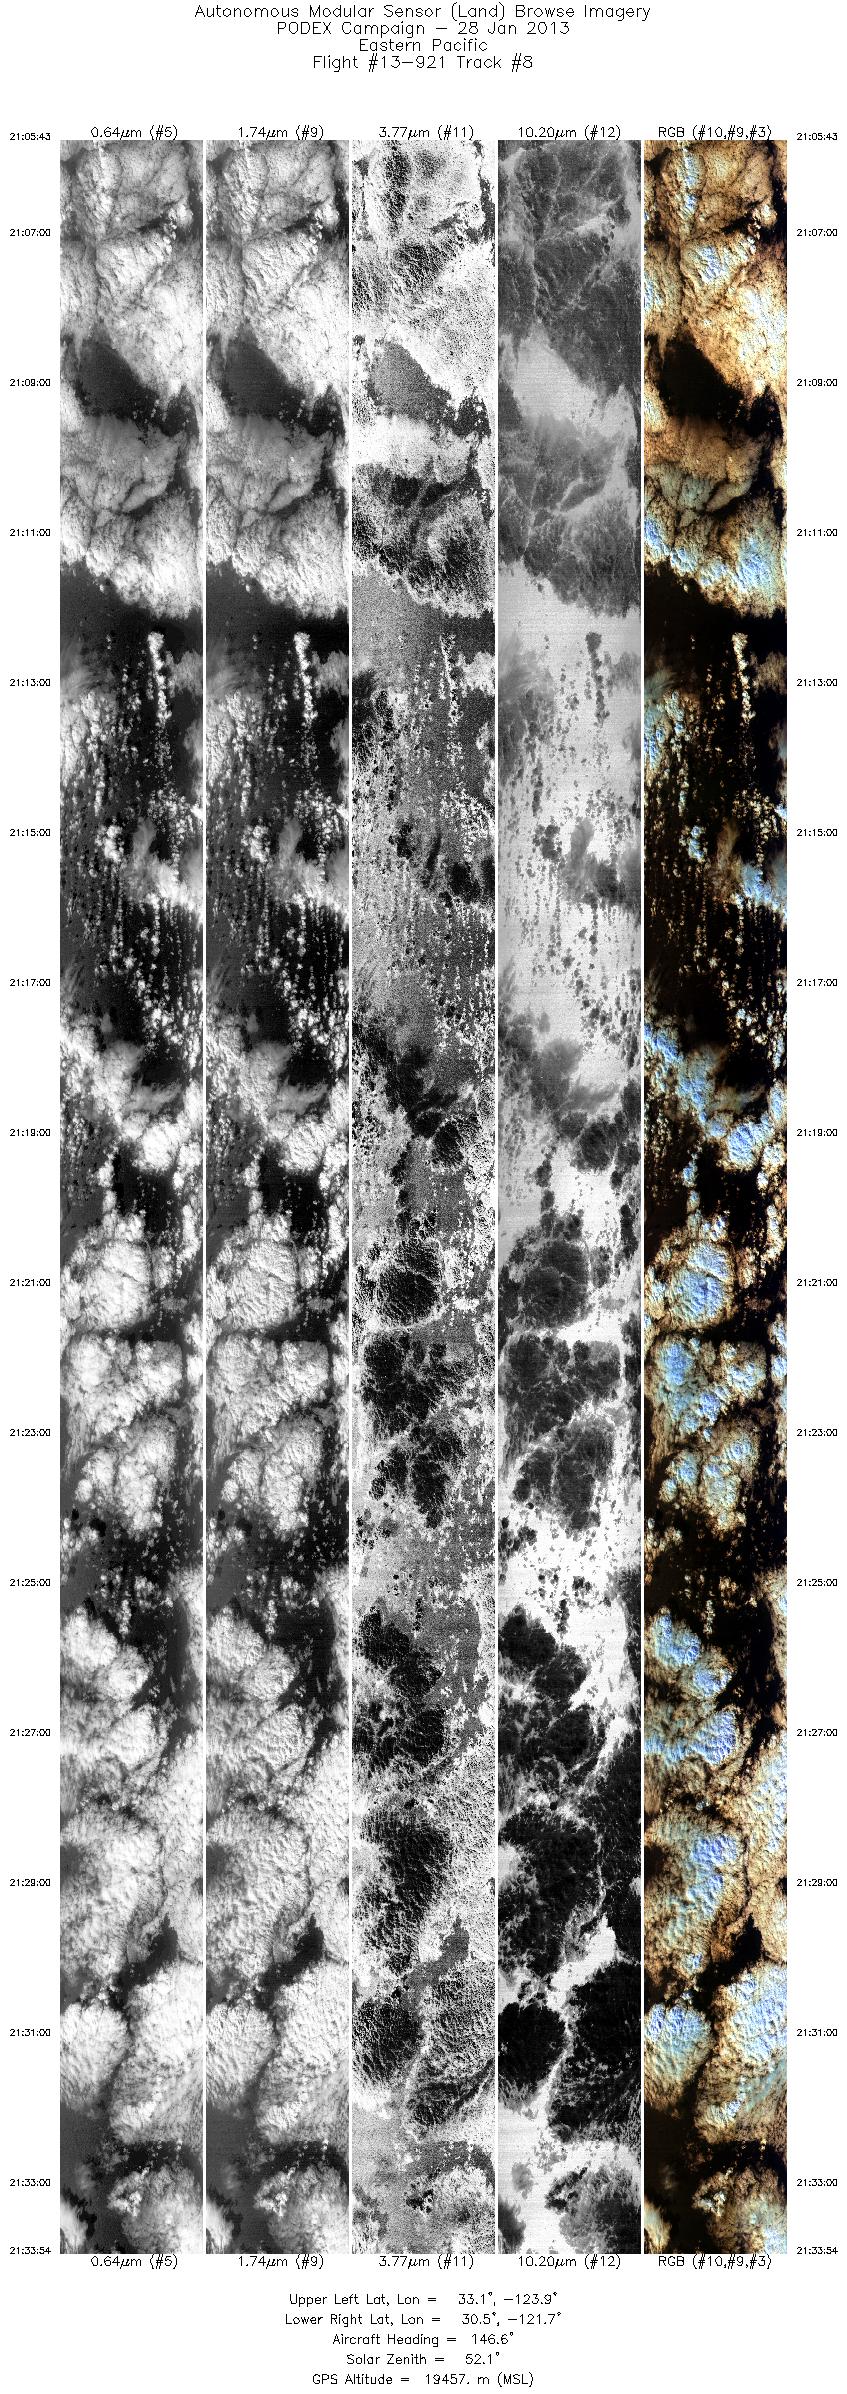
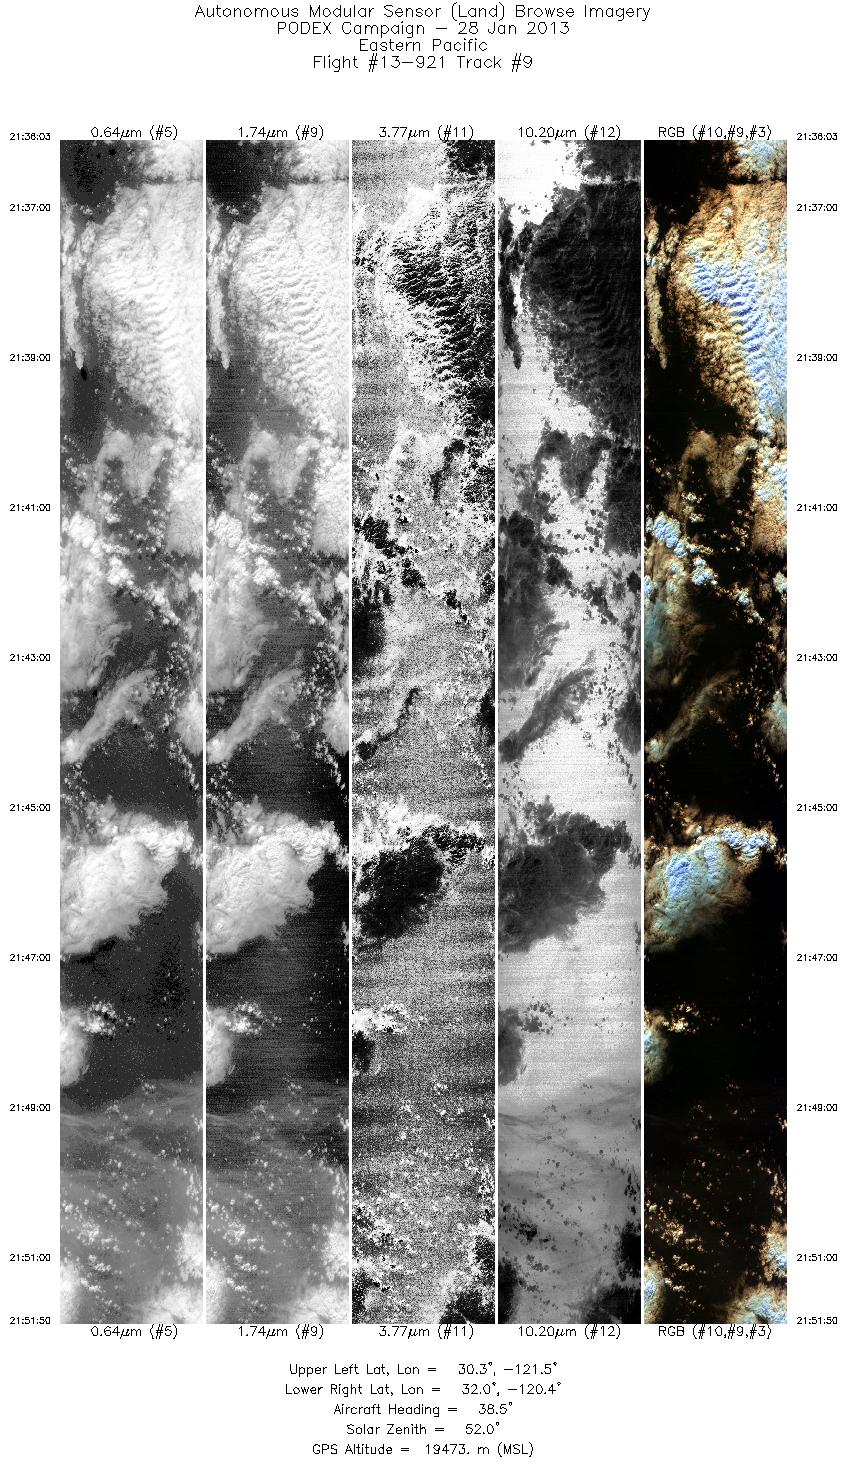
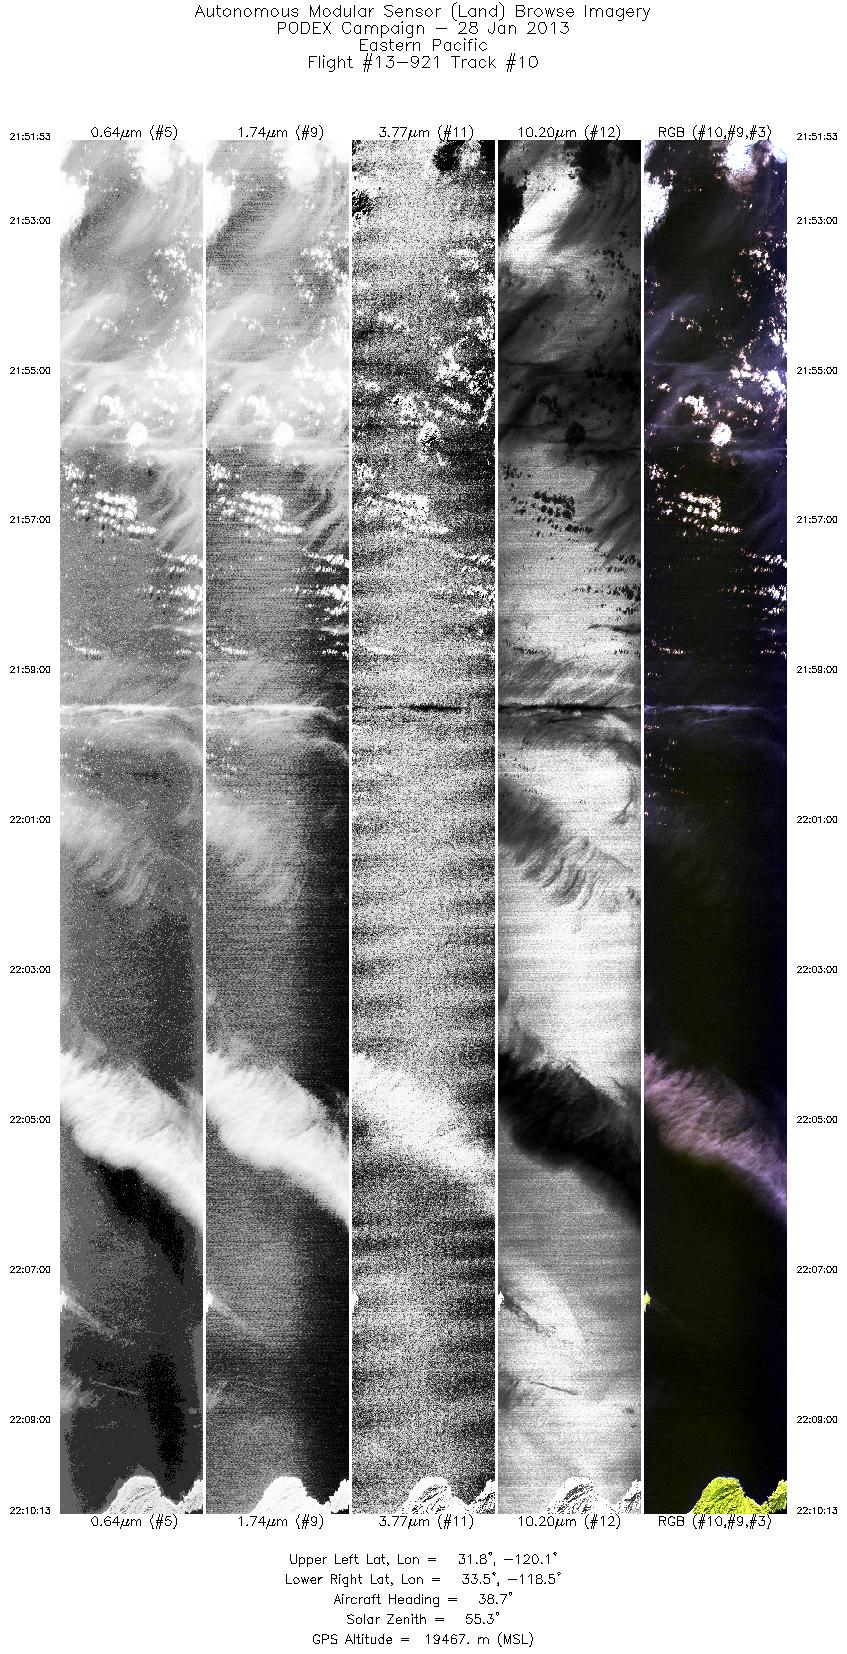
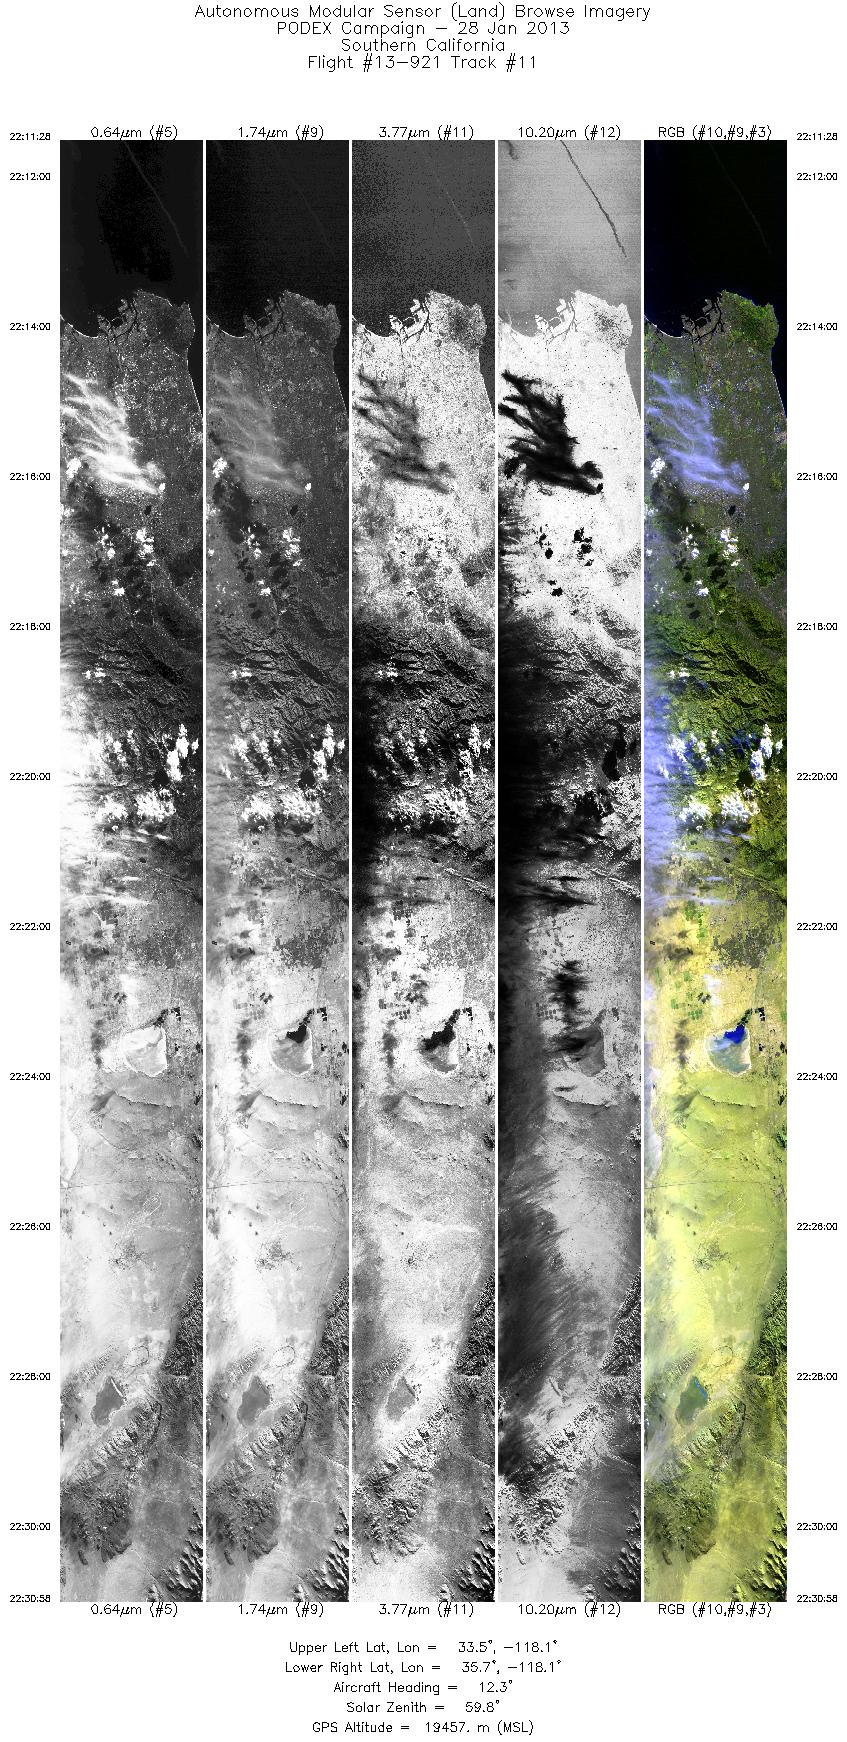
Flight: 13-921 Date: 28 Jan 2013 Location: Central California Deployment: PODEX 2013 Configuration: Land 2.50 mrad (16-Channel) Principal Investigators: David Starr (GSFC) Additional Sensors: AirMSPI, PACS, SSFR, RSP |
||||||||||||||||||||||||||||||||||||||||||||||||||||||||||||||||||||||||||||||||||||||||||||||||||||||||||||||||
|
Data Evaluation Overall quality is good |
||||||||||||||||||||||||||||||||||||||||||||||||||||||||||||||||||||||||||||||||||||||||||||||||||||||||||||||||
|
Processing Information Level-1B and Level-2 Data in HDF format are available from the LAADS DAAC Flight Line Summary Spectral Band Configuration Spectral Response Function Table Spectral Response Function (text) |
||||||||||||||||||||||||||||||||||||||||||||||||||||||||||||||||||||||||||||||||||||||||||||||||||||||||||||||||
|
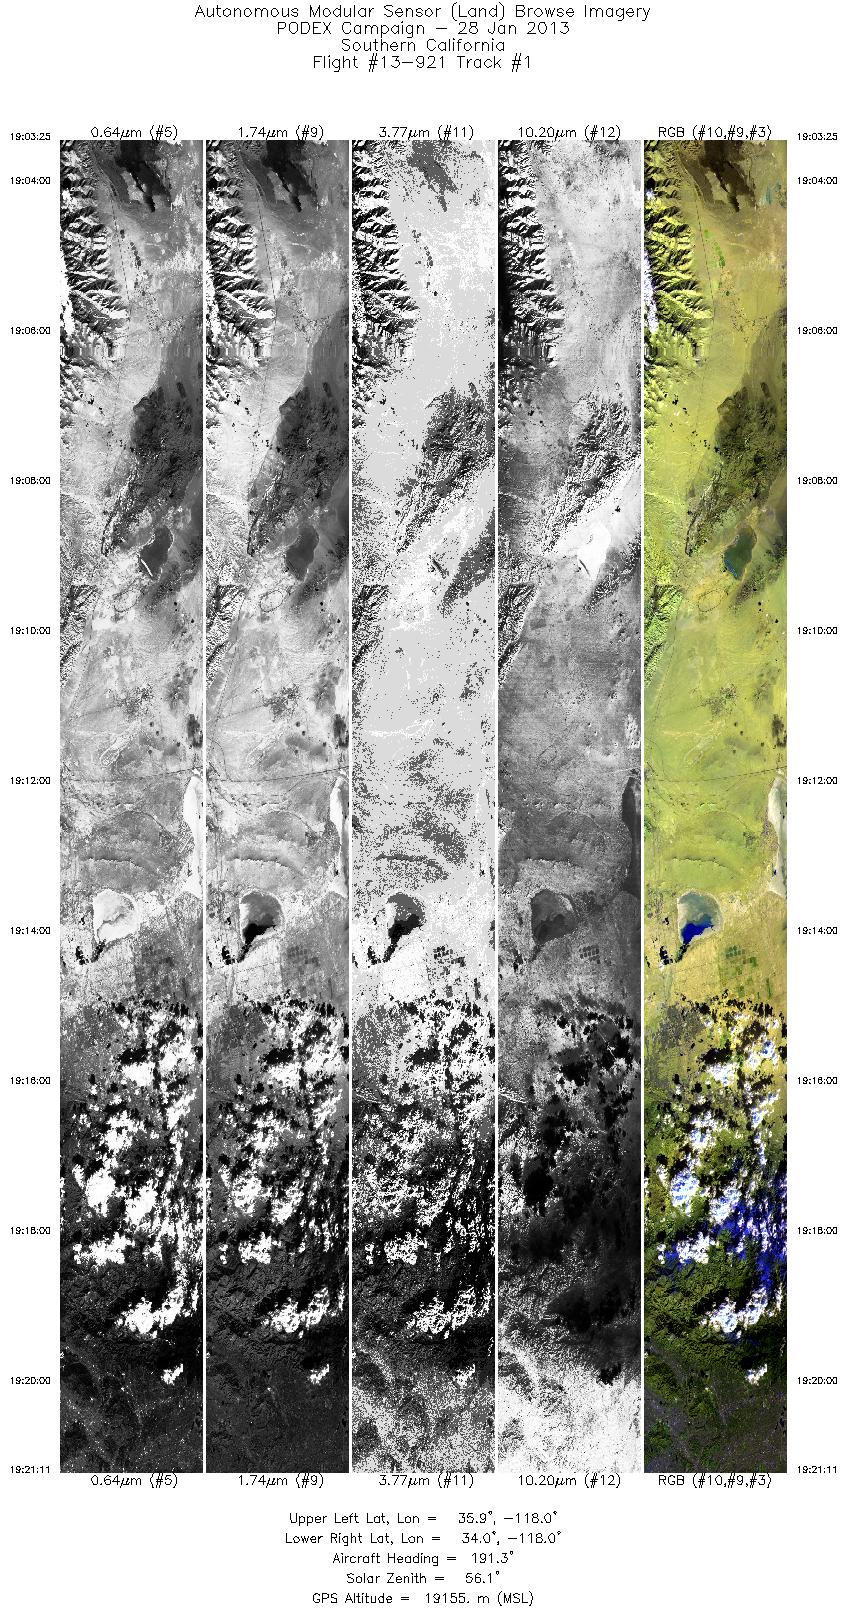
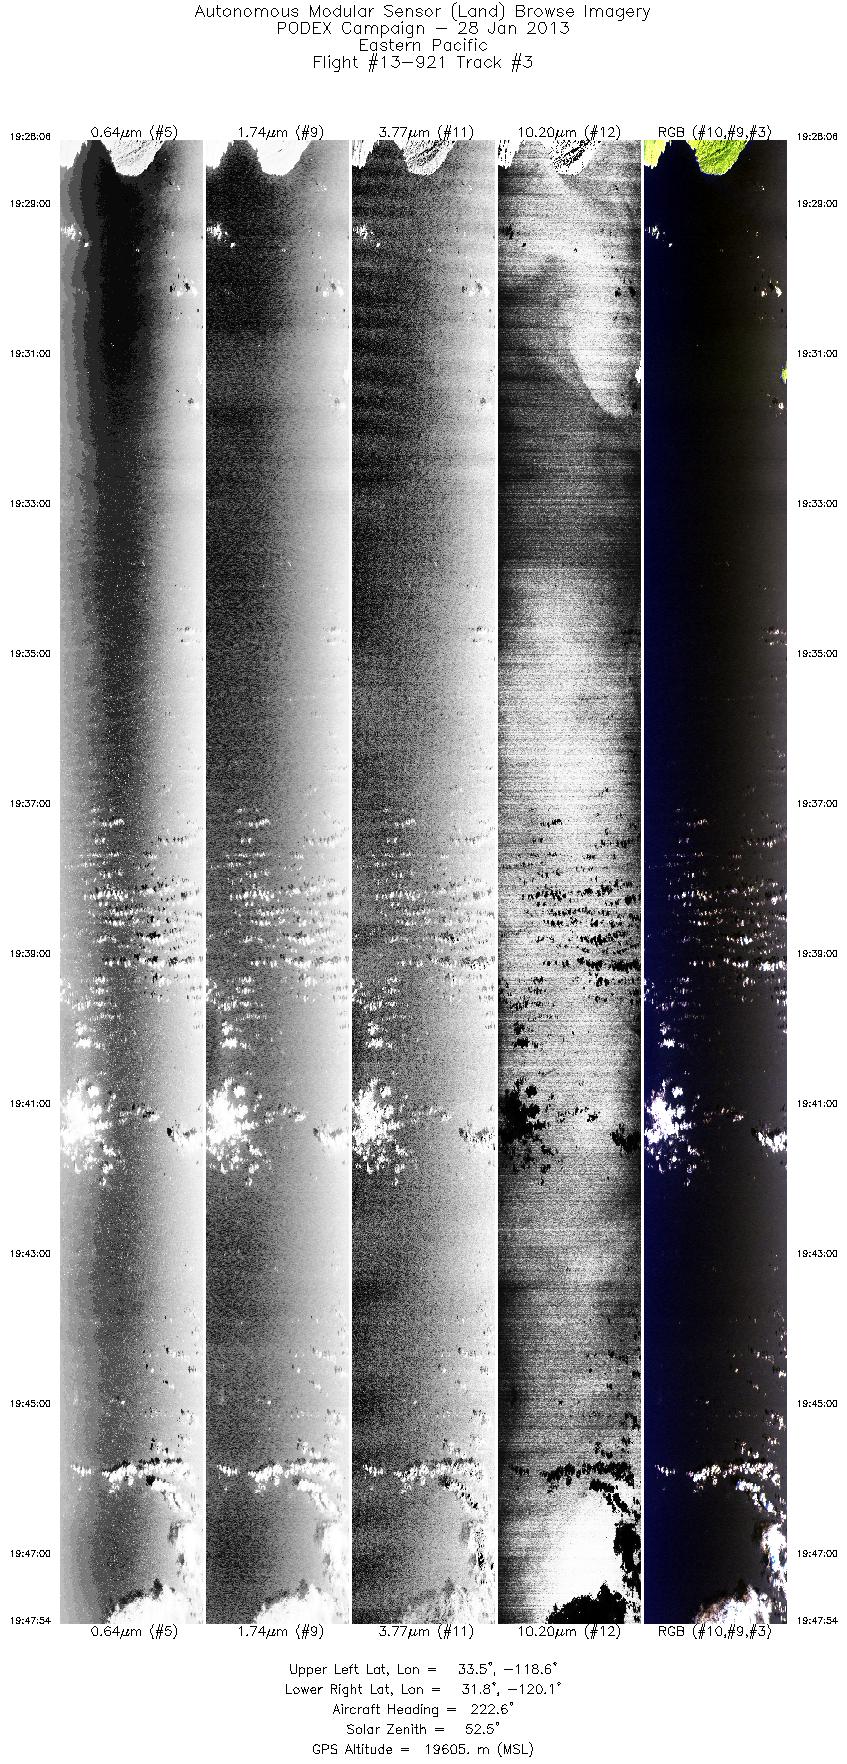
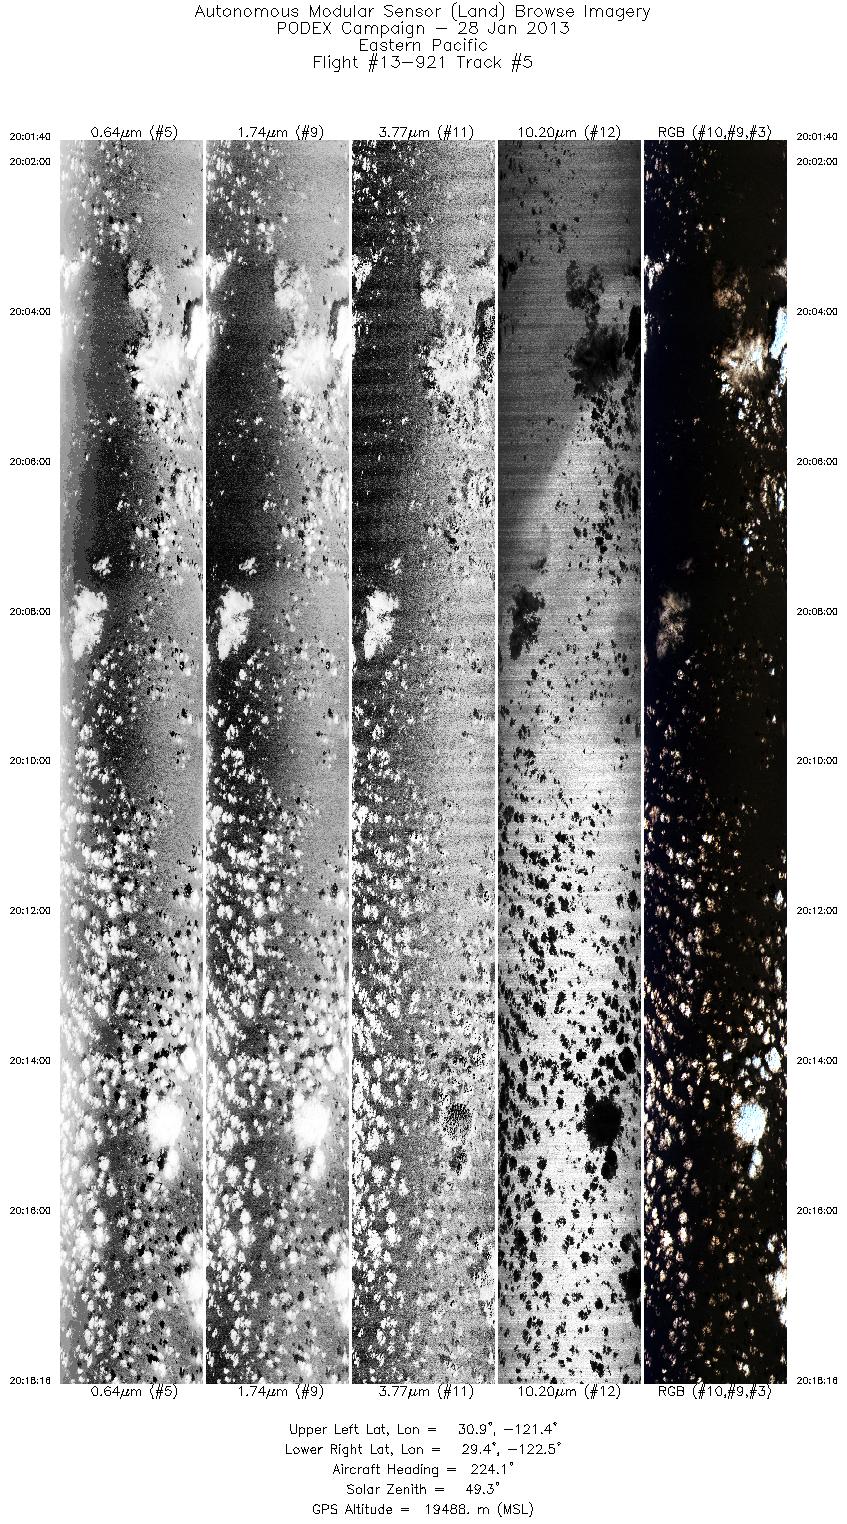
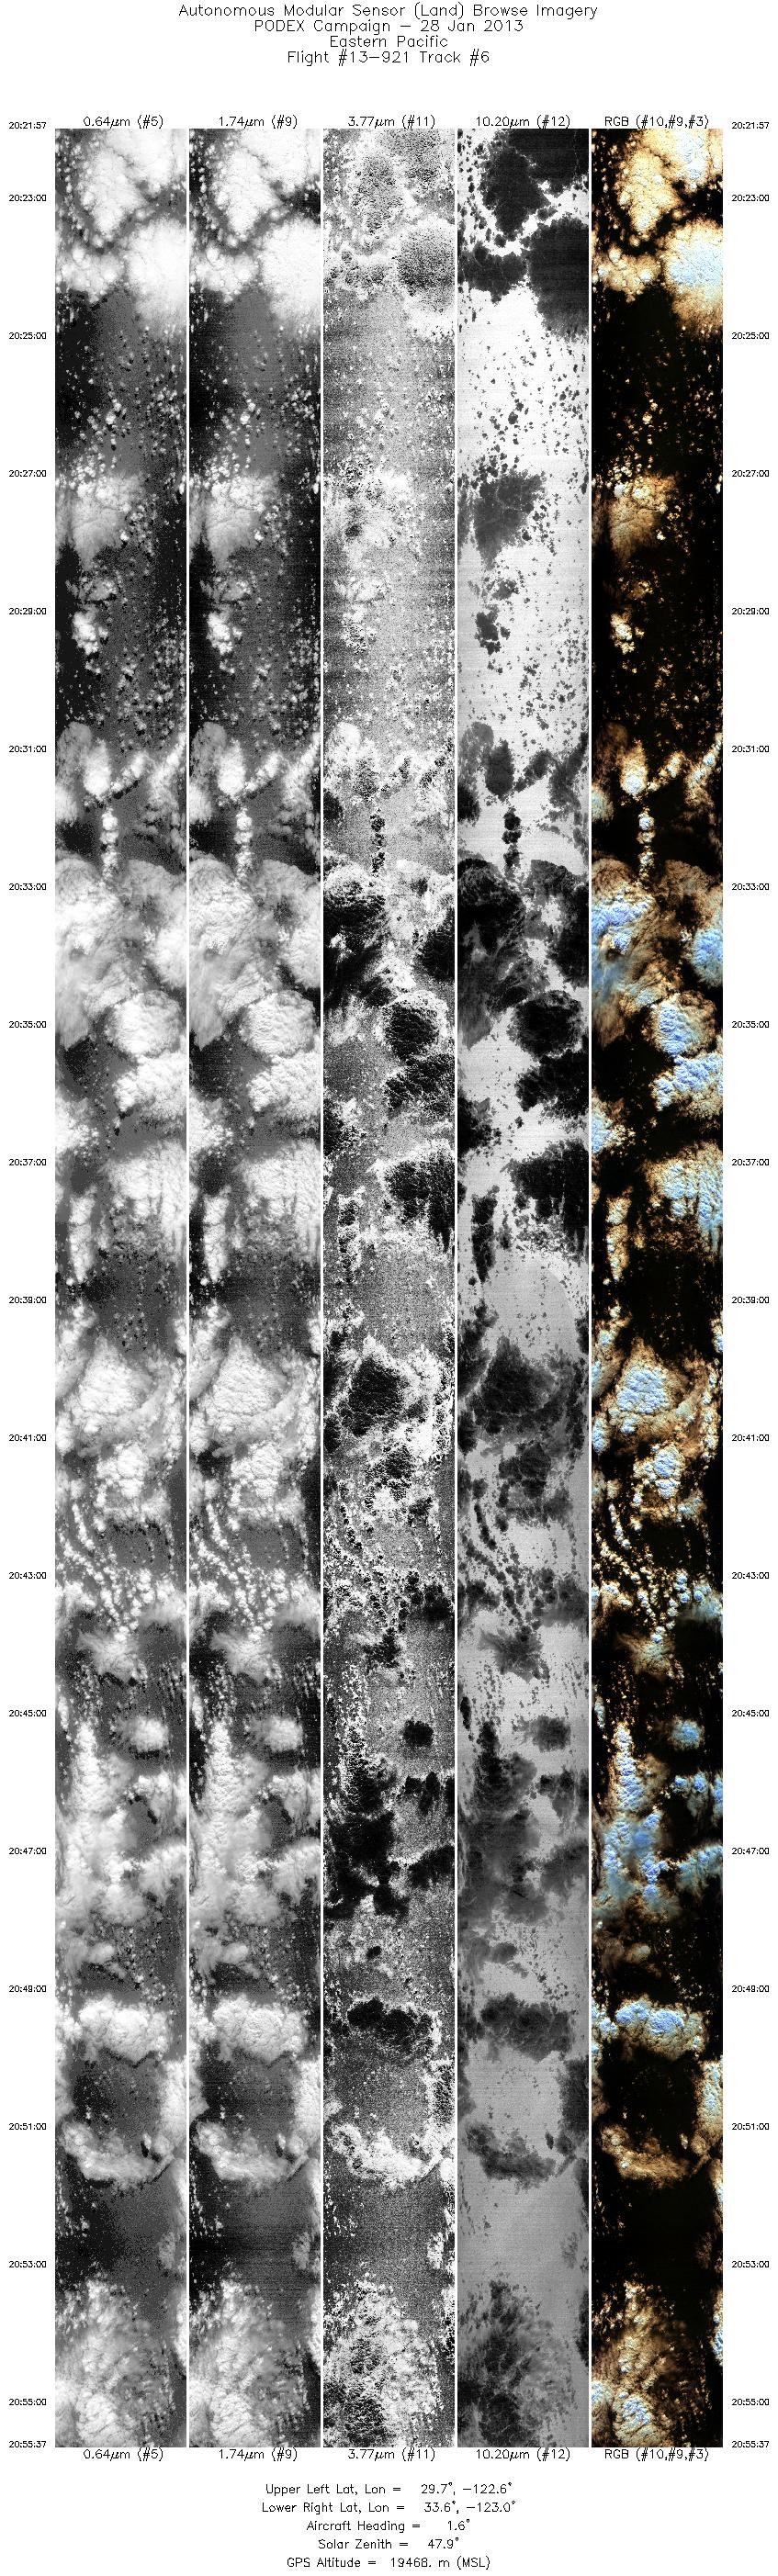
Browse Imagery Flight Tracks: 11 Scanlines: 73099 |
||||||||||||||||||||||||||||||||||||||||||||||||||||||||||||||||||||||||||||||||||||||||||||||||||||||||||||||||
|
||||||||||||||||||||||||||||||||||||||||||||||||||||||||||||||||||||||||||||||||||||||||||||||||||||||||||||||||

Flight 13-921


| Sample Imagery |
| Click image for full resolution |
|
Track #02 Long Beach, CA |


|
|
R: 2.26µm G: 1.74µm B: 0.55µm |
- NASA Official: Matt Fladeland
- Project Manager: James Jacobson
- Website Editor: Eric Fraim
- Last Updated: March 19, 2024