


FLIGHT SUMMARY INFORMATION
Flight Track Map


|
Flight: 09-911 Date: 12 Mar 2009 Location: California / Pacific Ocean Deployment: DFRC March 2009 Configuration: Air 2.5 (12-Channel) Principal Investigators: Functional Check Flight Additional Sensors: None |
||||||||||||||||||||||||||||||||||||||||||||||||||||||||||||||||||||||||||||||||||||||||||||||||||||||||||||||||
|
Data Evaluation Overall quality is good |
||||||||||||||||||||||||||||||||||||||||||||||||||||||||||||||||||||||||||||||||||||||||||||||||||||||||||||||||
|
Processing Information Level-1B Data in HDF format is available Flight Line Summary Spectral Band Configuration Spectral Response Function Table Spectral Response Function (text) |
||||||||||||||||||||||||||||||||||||||||||||||||||||||||||||||||||||||||||||||||||||||||||||||||||||||||||||||||
|
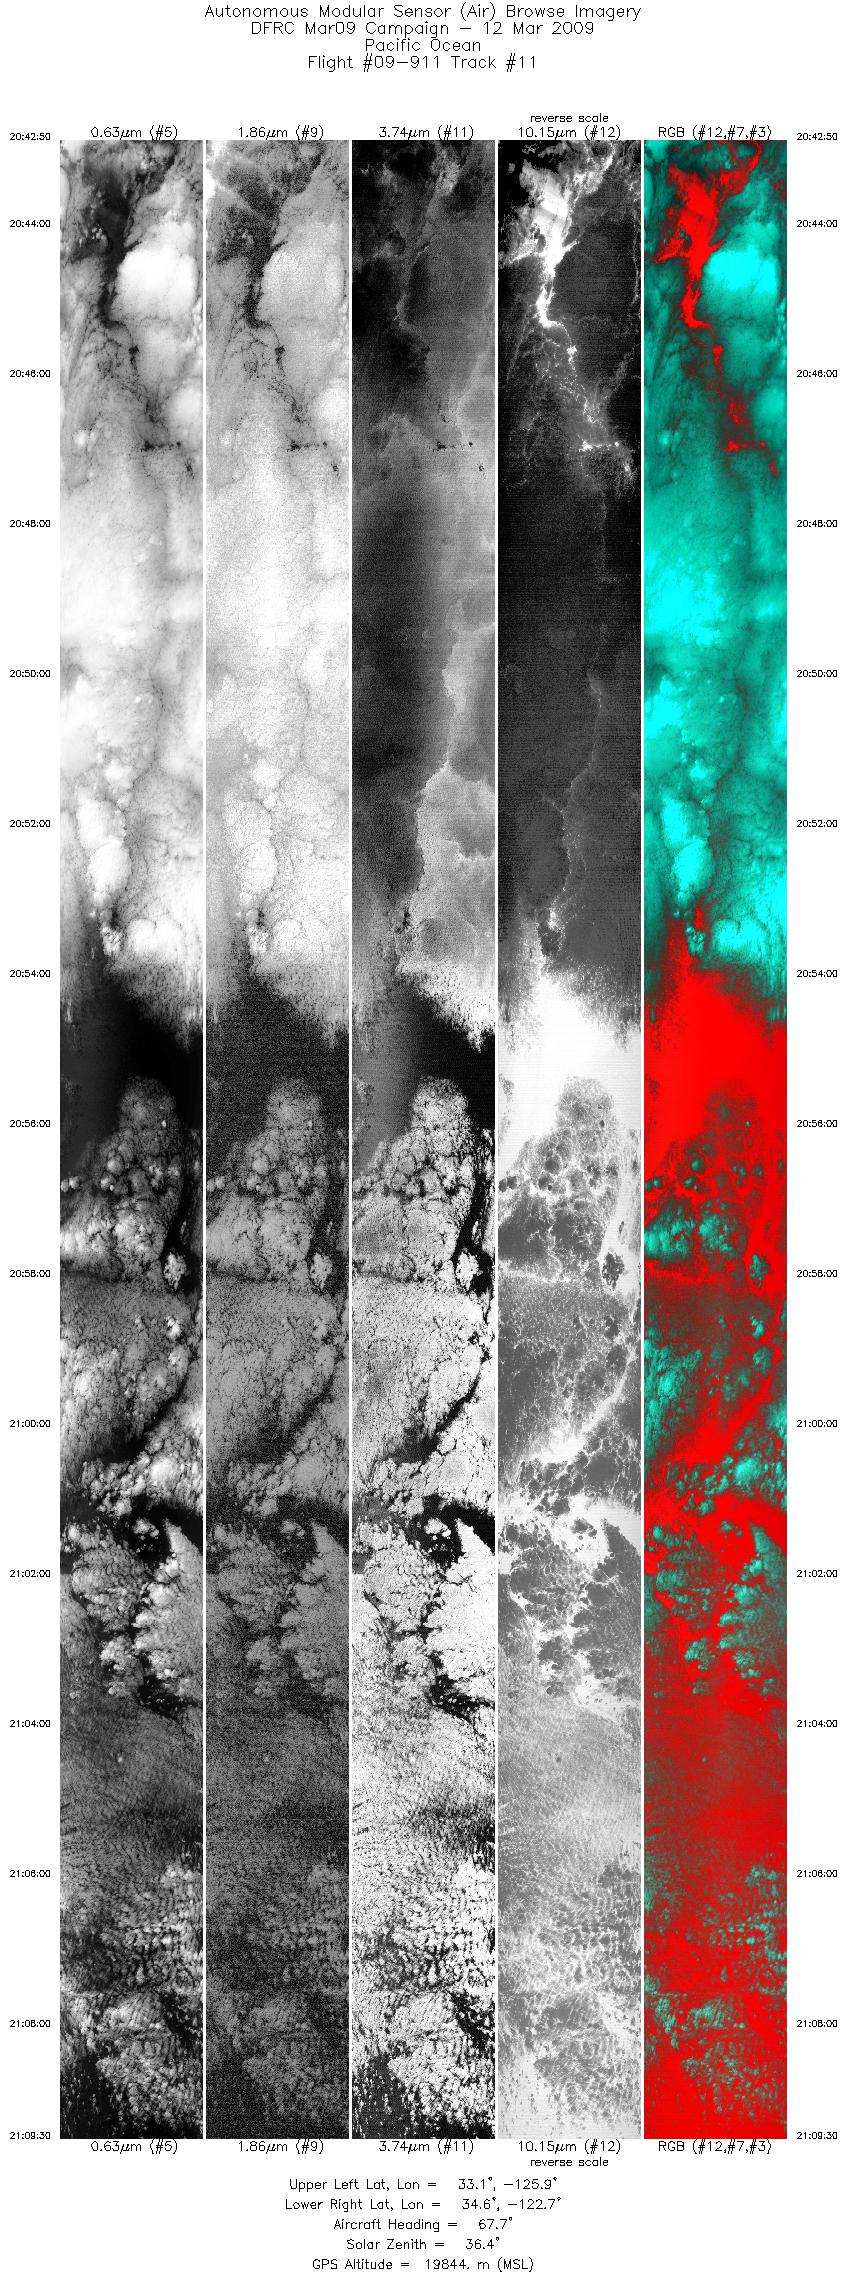
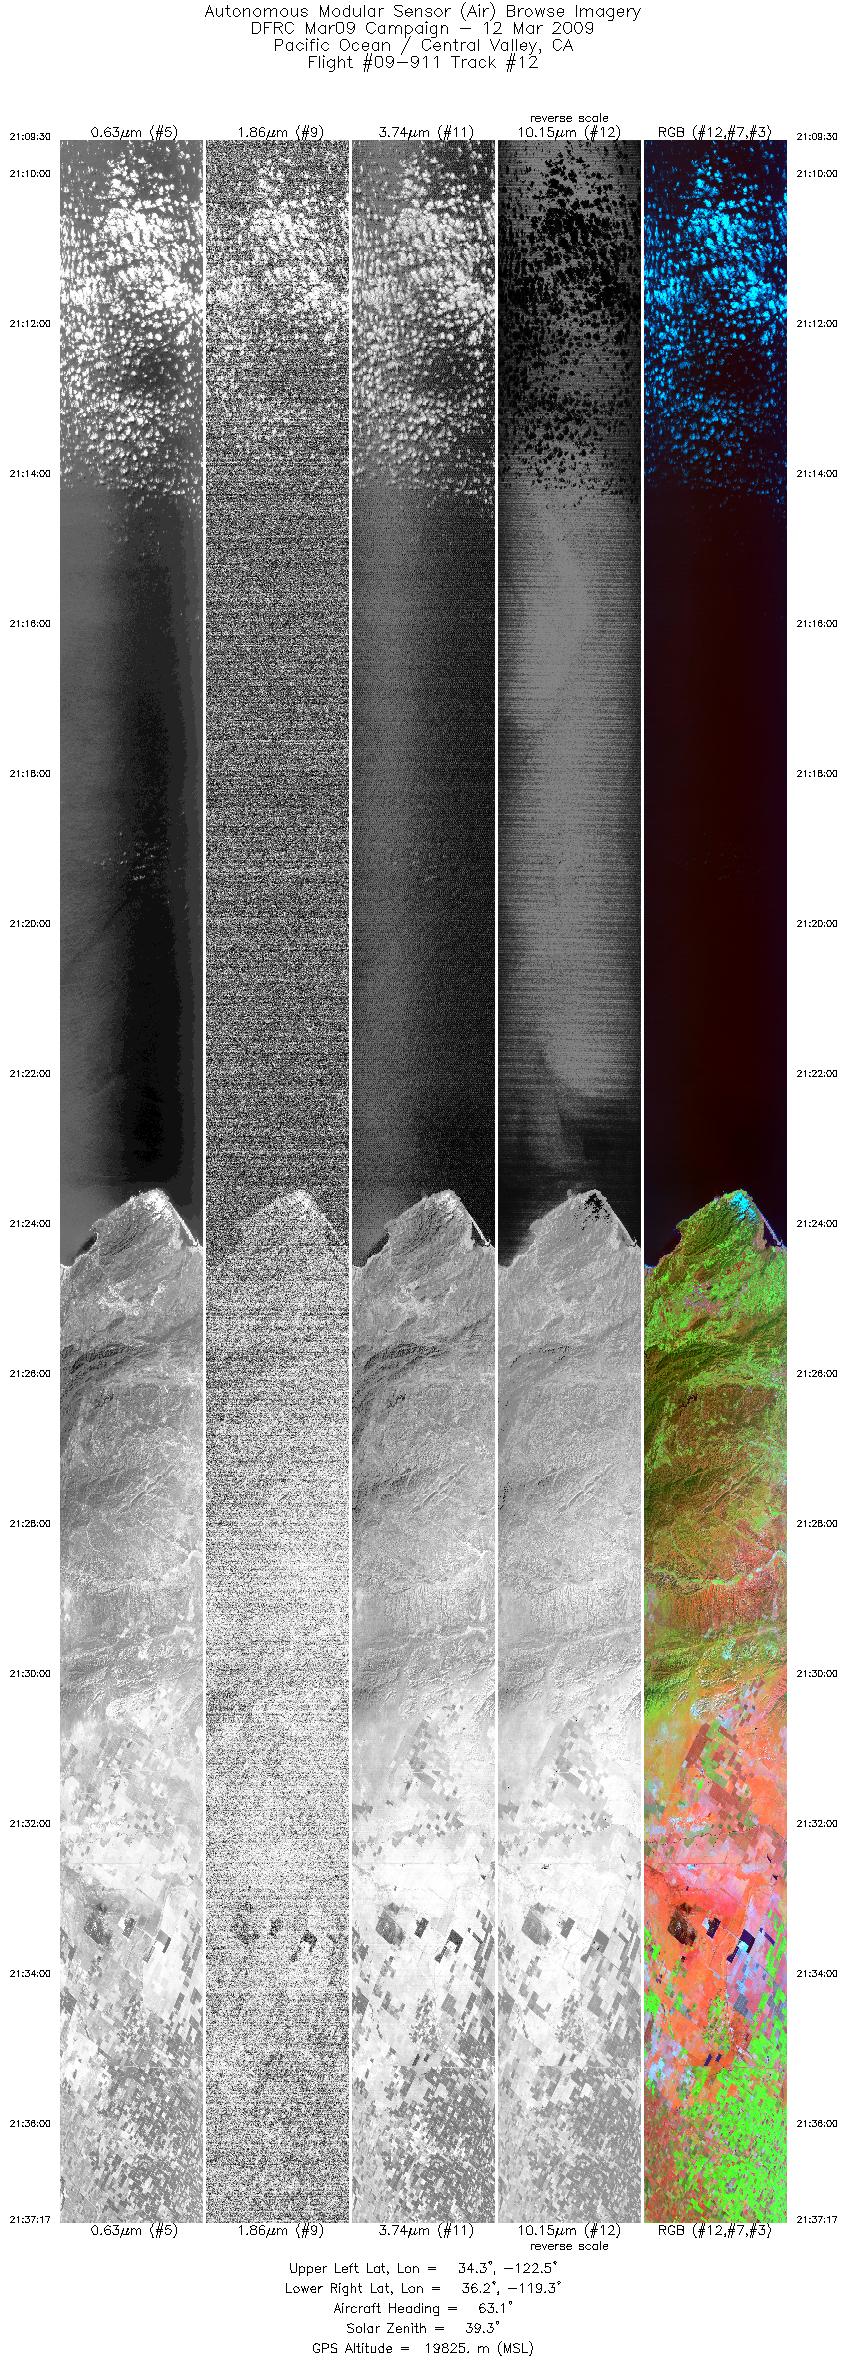
Browse Imagery Flight Tracks: 12 Scanlines: 94160 |
||||||||||||||||||||||||||||||||||||||||||||||||||||||||||||||||||||||||||||||||||||||||||||||||||||||||||||||||
|
||||||||||||||||||||||||||||||||||||||||||||||||||||||||||||||||||||||||||||||||||||||||||||||||||||||||||||||||

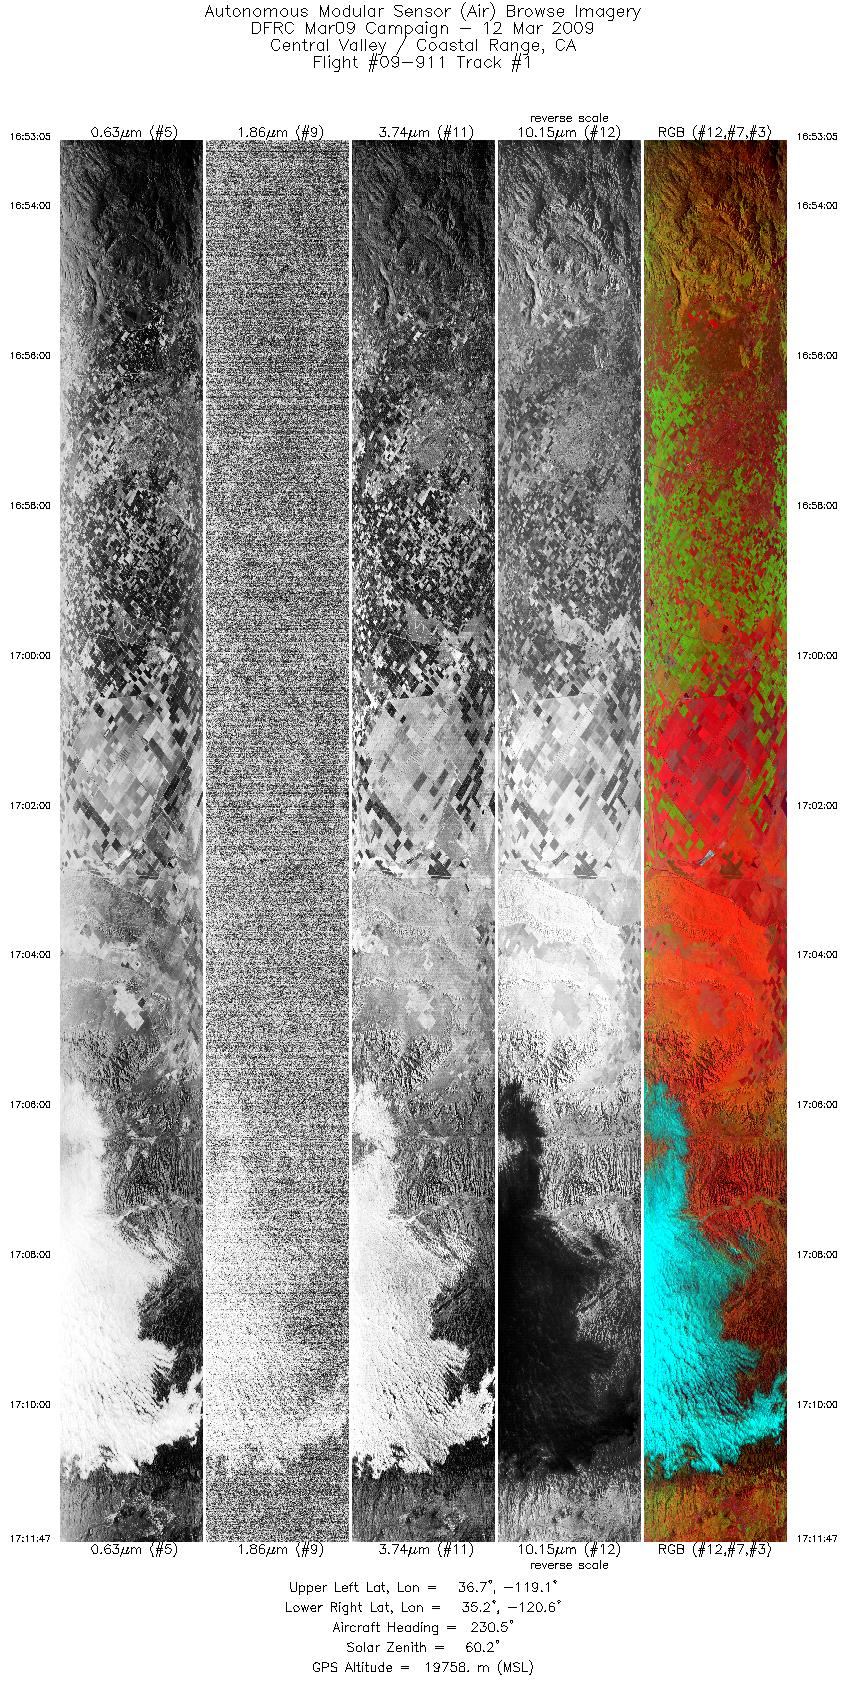
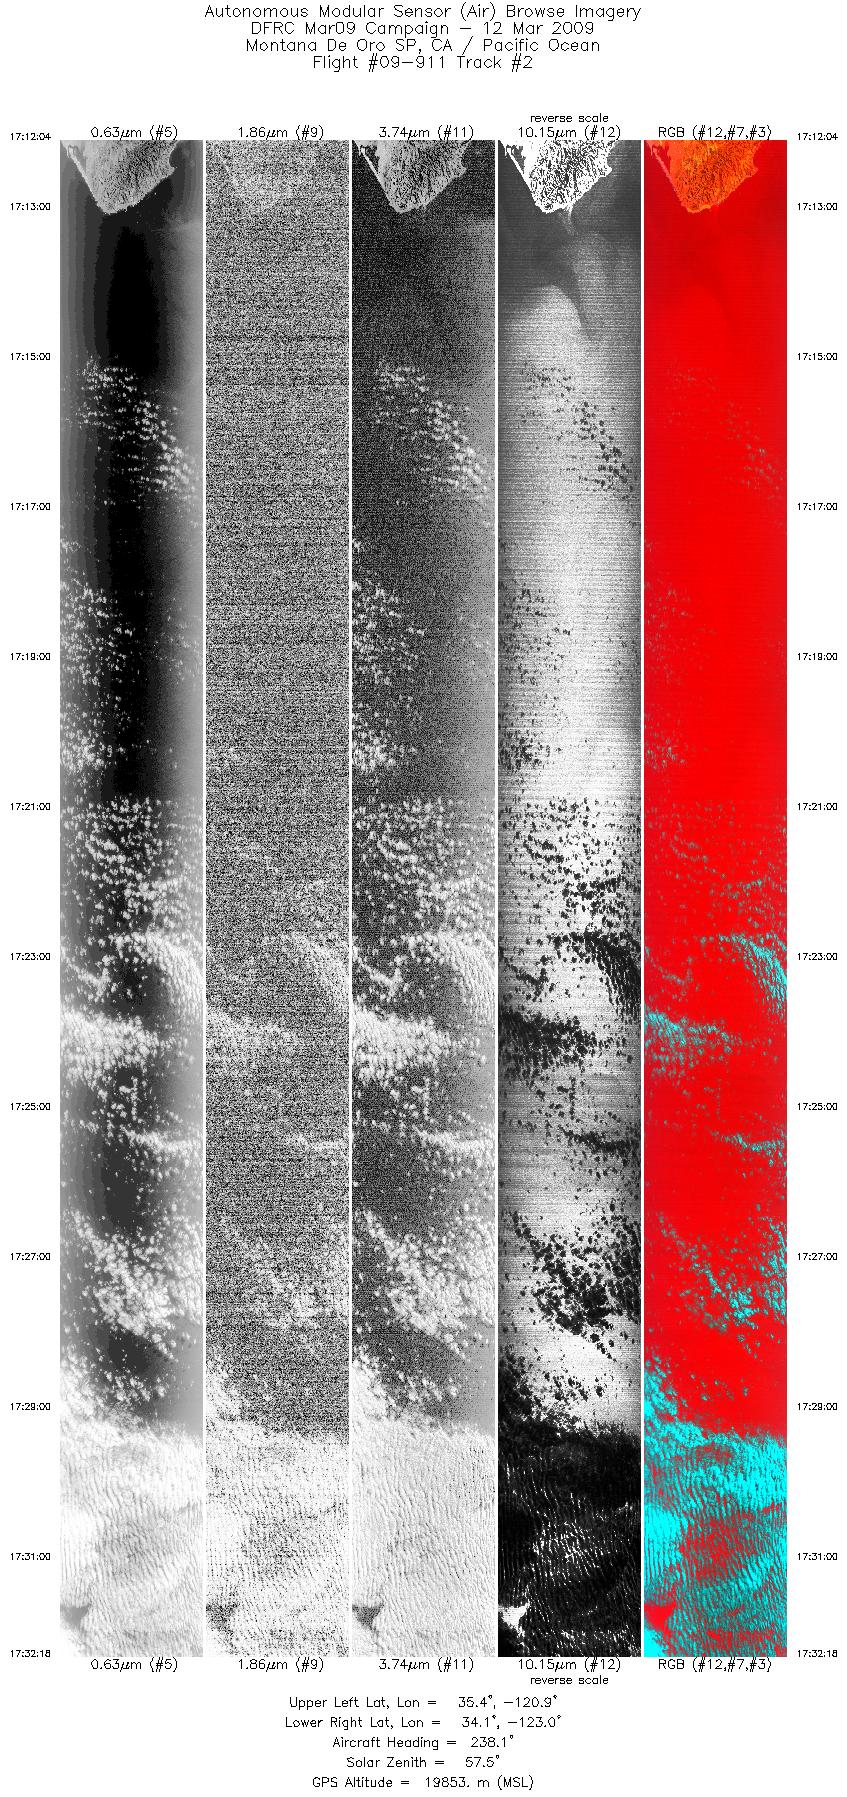
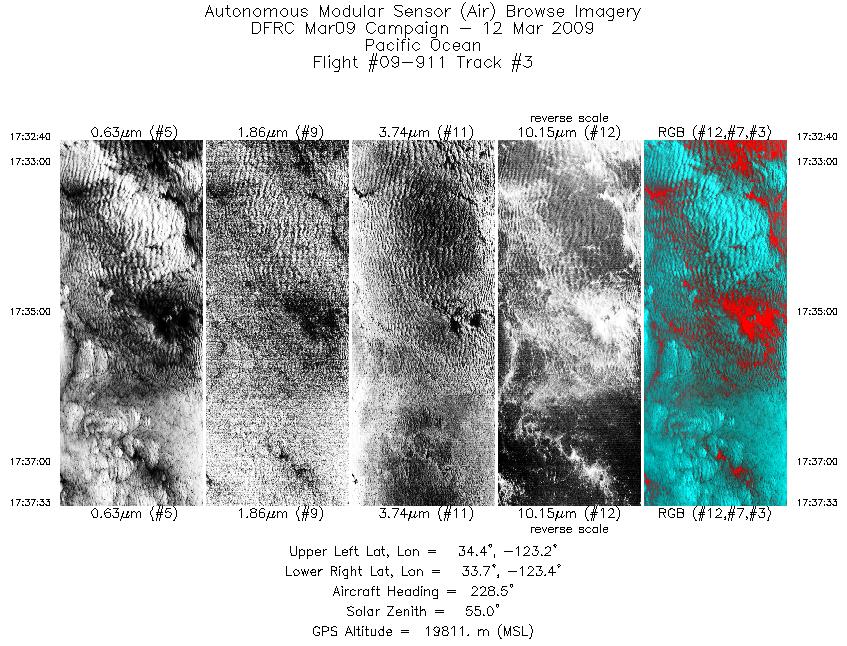
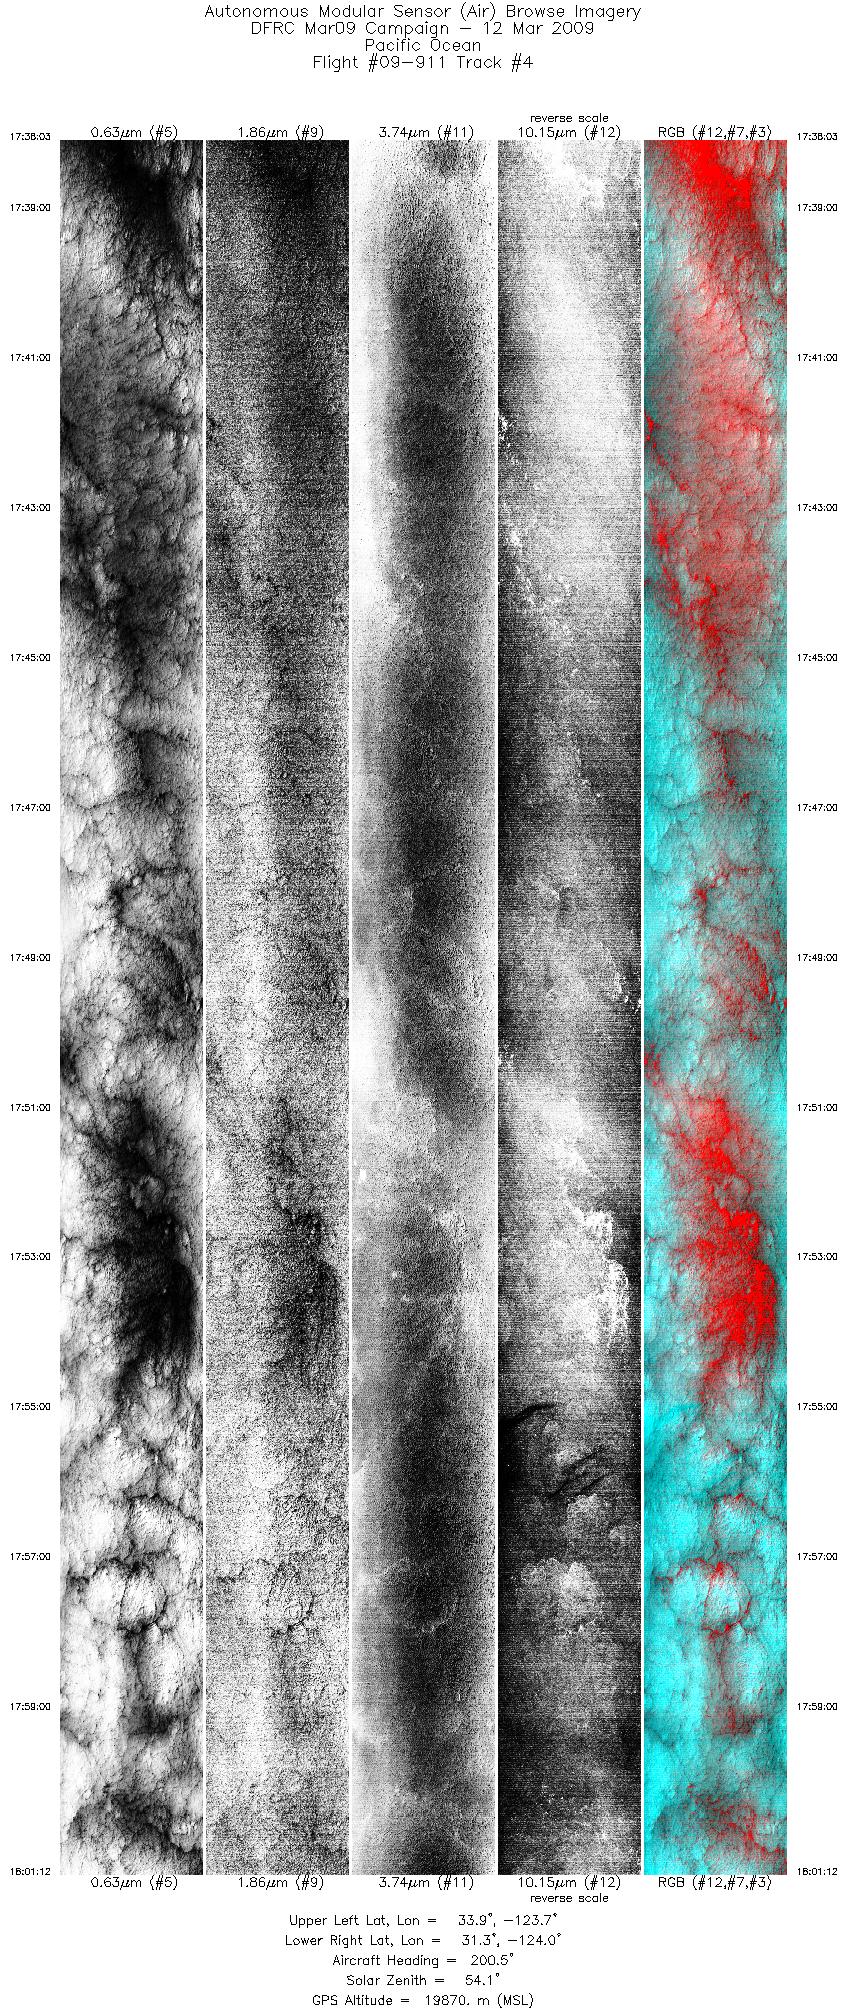
Flight 09-911


| Sample Imagery |
| Click image for full resolution |
|
Track #06 Pacific Ocean nTerra Overpass @19 |


|
|
R: 10.21µm G: 0.77µm B: 0.55µm |
- NASA Official: Matt Fladeland
- Project Manager: James Jacobson
- Website Editor: Eric Fraim
- Last Updated: March 19, 2024